- Welcome to Richland Community College! We are dedicated to helping you achieve your academic, personal, and overall education goals.
- The mission of Richland Community College is to provide innovative educational environments, opportunities, and experiences that enable individuals, communities, and the region to grow, thrive, and prosper.
School Highlights
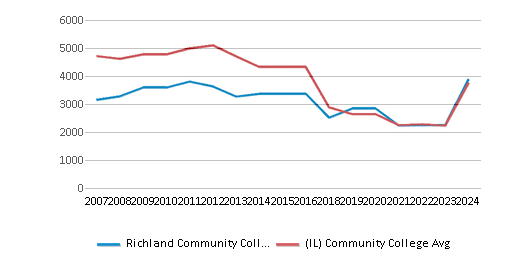
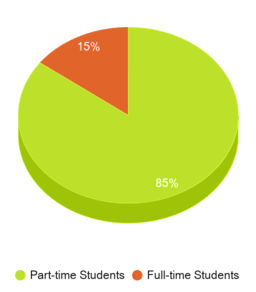
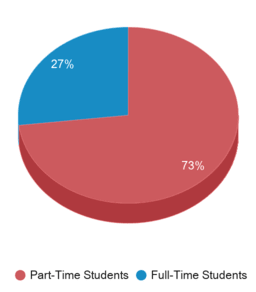
Richland Community College serves 3,885 students (15% of students are full-time).
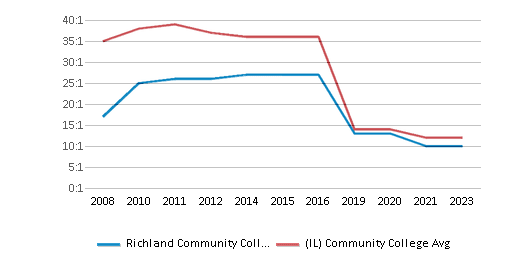
The college's student:teacher ratio of 18:1 is lower than the state community college average of 21:1.
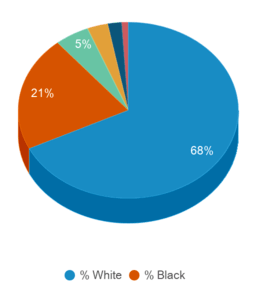
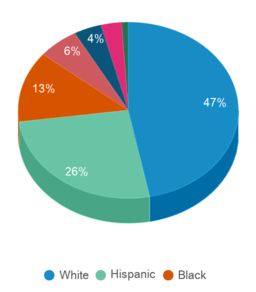
Minority enrollment is 32% of the student body (majority Black), which is less than the state average of 53%.
Quick Stats (2025)
- Enrollment: 3,885 students
- In-state tuition: $5,835
- Out-state tuition: $26,700
- Student:teacher ratio: 18:1
- Minority enrollment: 32%
- Source: Verified school update
School Overview
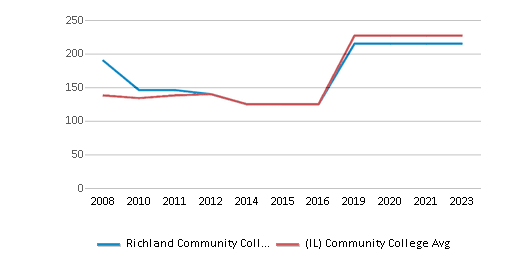
The teacher population of 215 teachers has stayed relatively flat over five years.
Richland Community College
(IL) Community College Avg.
Carnegie Classification
Associate's Colleges: High Career & Technical-High Nontraditional
Associate's Colleges: Mixed Transfer/Career & Technical-High Nontraditional
Institution Level
At least 2 but less than 4 years
At least 2 but less than 4 years
Institution Control
Public
Public
Total Faculty
215 staff
227 staff
School Calendar
Student Body
The student population of Richland Community College has grown by 36% over five years.
The student:teacher ratio of 18:1 has increased from 10:1 over five years.
The Richland Community College diversity score of 0.49 is less than the state average of 0.69. The school's diversity has grown by 18% over five years.
Total Enrollment
3,885 students
3,270 students
Student : Teacher Ratio
18:1
21:1
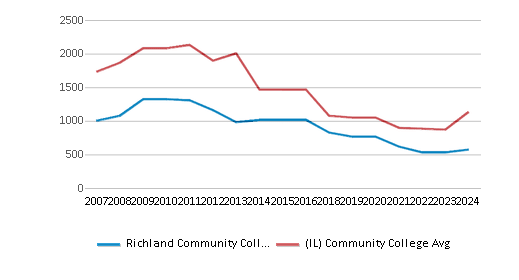
# Full-Time Students
575 students
1,007 students
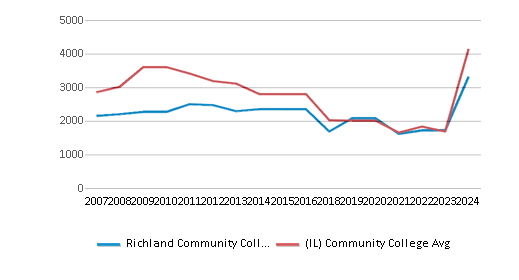
# Part-Time Students
3,310 students
2,747 students
# Enrollment Undergraduate
388 students
328 students
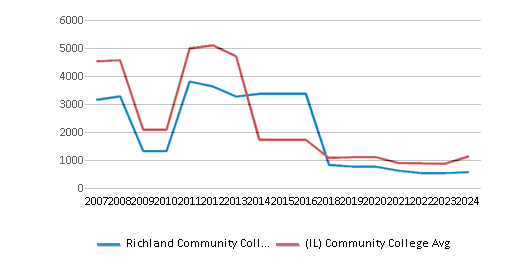
# Full-Time Undergraduate Students
575 students
1,007 students
# Full-Time Graduate Students
n/a
43 students
# Part-Time Undergraduate Students
3,310 students
3,310 students
# Part-Time Graduate Students
n/a
18 students
Total Dormitory Capacity
n/a
132 students
% American Indian/Alaskan
n/a
n/a
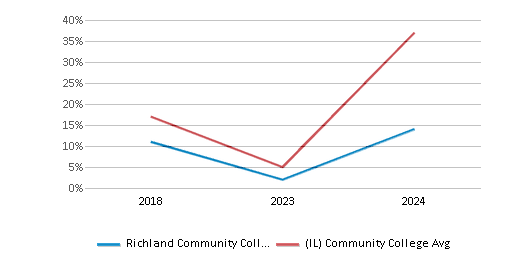
% Asian
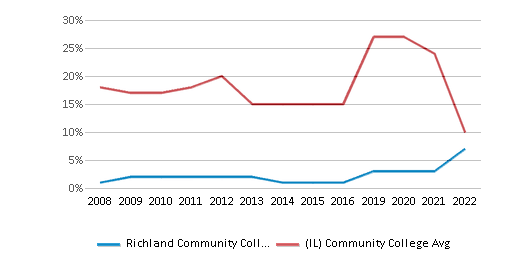
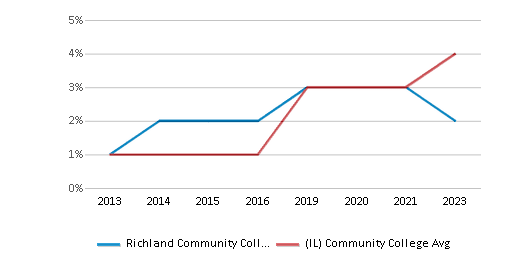
1%
6%
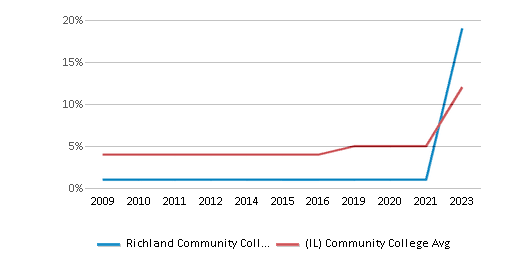
% Hispanic
5%
26%
% Black
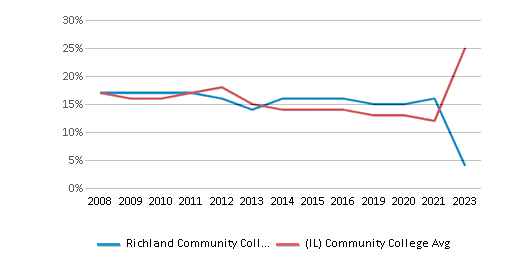
21%
13%
% White
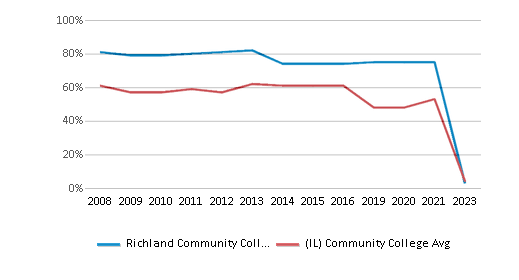
68%
47%
% Hawaiian
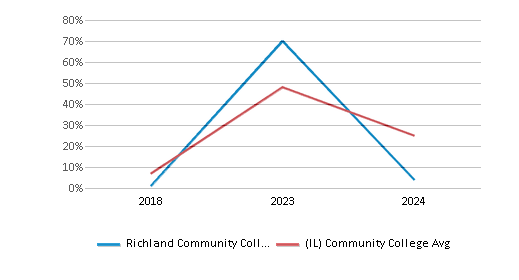
n/a
n/a
% Two or more races
3%
3%
% Non Resident races
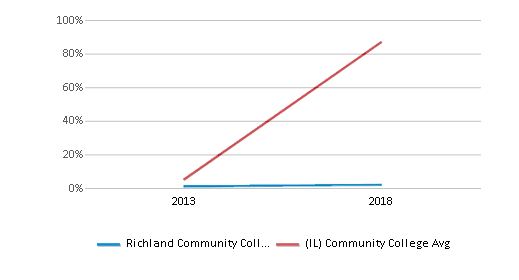
n/a
1%
% Unknown races
2%
4%
Diversity Score
0.49
0.69
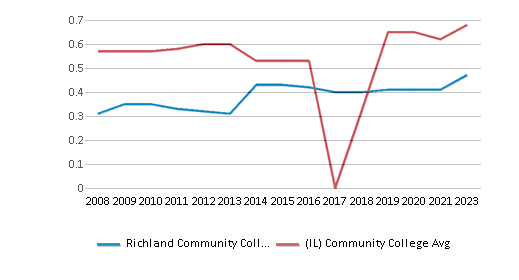
College Completion Rate (Students who graduate in less than 4 years)
0.4%
0.4%
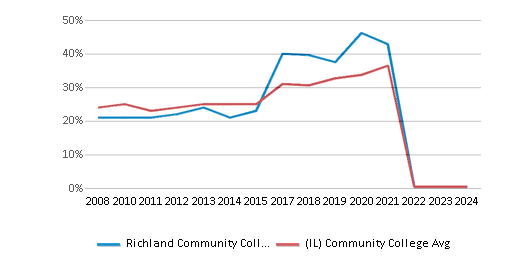
College Completion Rate (Students who graduate in 4 years or more than 4 years)
n/a
0.38%
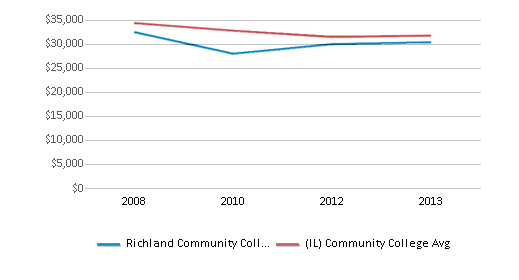
Average Graduate Earnings (10 Years)
$30,400
$31,800
Tuition and Acceptance Rate
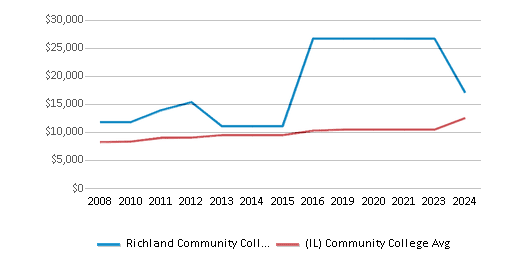
The public in-state tuition of $5,835 is less than the state average of $7,875. The in-state tuition has declined by 6% over four years.
The public out-state tuition of $26,700 is more than the state average of $10,847. The out-state tuition has grown by 85% over four years.
In-State Tuition Fees
$5,835
$7,875
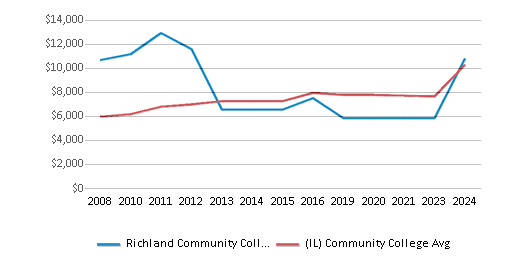
Out-State Tuition Fees
$26,700
$10,847
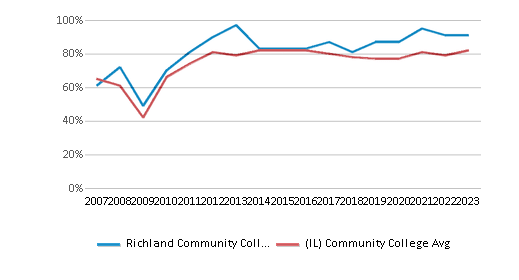
% Students Receiving Some Financial Aid
91%
82%
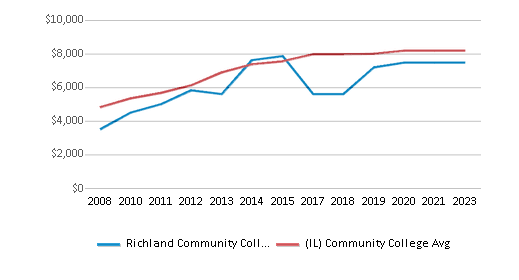
Median Debt for Graduates
$7,477
$8,187
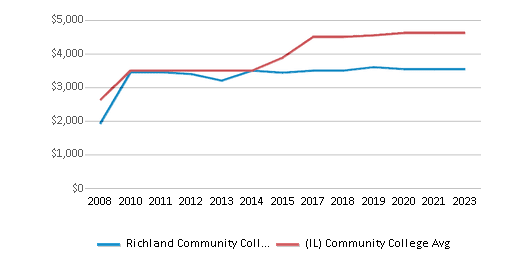
Median Debt for Dropouts
$3,542
$4,618
Acceptance Rate
n/a
89%
SAT Reading
n/a
390
SAT Math
n/a
360
SAT Writing
n/a
355
ACT Composite
n/a
17
ACT English
n/a
17
ACT Math
n/a
17
Extracurriculars
Total ExtracurricularsTotal Extra-curric.
13 extracurriculars
ExtracurricularsExtra-curric.
Club or Organization:
Alpha Delta Nu, Black Student Association, Delta Alpha Pi, H.O.P.E. Club (Helping Out People Everywhere), Intervarsity Christian Fellowship, Media Club/Communicatur, Nursing Club, P.R.I.D.E. (People Respecting Individual Differences in Everyone), Phi Theta Kappa, Student Government Association (SGA), Student Leaders in the Community (SLIC), Surgical Technology Club, X-Ray Vision Club
Alpha Delta Nu, Black Student Association, Delta Alpha Pi, H.O.P.E. Club (Helping Out People Everywhere), Intervarsity Christian Fellowship, Media Club/Communicatur, Nursing Club, P.R.I.D.E. (People Respecting Individual Differences in Everyone), Phi Theta Kappa, Student Government Association (SGA), Student Leaders in the Community (SLIC), Surgical Technology Club, X-Ray Vision Club
Source: 2024 (or latest year available) Integrated Postsecondary Education Data System (IPEDS) , School Administrators
School Notes
- Richland Community College, founded in 1971, is a comprehensive community college offering transfer/baccalaureate, technical, continuing education, and community service programs. The College has an "Open Door" policy, which allows anyone within the District that could benefit from higher education to be admitted to the College. The purpose of a comprehensive community college is to serve all who then can serve to build a better society. Richland serves residents of Macon County and parts of Christian, DeWitt, Logan, Moultrie, Piatt, Sangamon, and Shelby Counties. Approximately 6,600 students are served annually at the main campus in Decatur, the Clinton Higher Learning Center, the Fairview Park Plaza Center, and other locations throughout the District. Richland offers several transfer/baccalaureate associate degrees, including Associate of Arts, Associate of Science, Associate of Fine Arts, and Associate of Engineering Science. Over 30 areas of concentration (majors) are available for students. Students can transfer their credits to a four-year college or university. The Career and Technical Education (CTE) Programs are designed to prepare students to move directly into the workforce with specific skills. Students can earn Basic Certificates, Advanced Certificates or Associate in Applied Science Degrees in over 40 different career areas. Customized training is available through the Continuing and Professional Education Division. Students can select from a broad scope of programs designed to meet all types of needs including computer, basic skills, customer services, technical training, occupational safety training, commercial truck drivers, and management training.
Frequently Asked Questions
How much does Richland Community College cost?
Richland Community College's tuition is approximately $5,835 for In-State students and $26,700 for Out-State students.
Recent Articles

Obtaining Your Bachelor's Degree at a Community College
Explore the evolving landscape of community colleges offering bachelor's degrees, addressing affordability, accessibility, and workforce needs.

A to Z of Community College Certificates and Courses
From business and healthcare to technology and skilled trades, the article showcases the breadth of options available to students seeking to enhance their knowledge, develop new skills, or pursue career advancement.

What is a Community College?
This comprehensive guide explains what a community college is, its history, and its role in higher education. It covers the types of programs offered, differences from four-year colleges, benefits of attending, and important considerations for prospective students, providing valuable insights for those exploring educational options.


