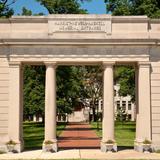
Lincoln Land Community College Photo #1 - Menard and Sangamon Halls, the main instructional buildings at Lincoln Land Community College, feature a beautiful outdoor gathering and study area on a lake.

Lincoln Land Community College

  • Lincoln Land Community College serves residents of the largest community college district in the state of Illinois, with convenient campuses in Springfield (main campus); Capital City Training Center; Levi, Ray and Shoup, Inc. Aviation Center at LLCC,  and Outreach Centers in Taylorville, Jacksonville, Beardstown and Litchfield. Excellence in teaching and student-centeredness are hallmarks of LLCC. Classes are offered days, nights and weekends as well as many online programs and courses. With an 18-to-1 student/faculty ratio, LLCC professors know their students and work hard to help them succeed.

School Highlights

Lincoln Land Community College serves 4,840 students (36% of students are full-time).
The college's student:teacher ratio of 11:1 is lower than the state community college average of 12:1.
Minority enrollment is 94% of the student body (majority Asian), which is less than the state average of 96%.

Quick Stats (2024-25)

  • Enrollment: 4,840 students
  • Acceptance Rate: 100%
  • Student:teacher ratio: 11:1
  • Minority enrollment: 94%
  • Source: Verified school update

School Overview

The teacher population of 438 teachers has stayed relatively flat over five years.
Lincoln Land Community College
(IL) Community College Avg.
Carnegie Classification
Associates Colleges
Associates Colleges
Institution Level
At least 2 but less than 4 years
Institution Control
Public
Public
Total Faculty
438 staff
227 staff
This chart displays total faculty of Lincoln Land Community College and community college average number of faculty in Illinois by year, with the latest 2022-23 school year data.

Student Body

The student population of Lincoln Land Community College has declined by 11% over five years.
The student:teacher ratio of 11:1 has decreased from 12:1 over five years.
The Lincoln Land Community College diversity score of 0.46 is less than the state average of 0.69. The school's diversity has stayed relatively flat over five years.
Total Enrollment
4,840 students
2,558 students
This chart displays the total enrollment of Lincoln Land Community College and community college average number of enrollment of Illinois by year, with the latest 2022-23 school year data.
Student : Teacher Ratio
11:1
12:1
This chart displays the student staff ratio of Lincoln Land Community College and community college average student staff ratio of Illinois by year, with the latest 2022-23 school year data.
# Full-Time Students
1,758 students
872 students
This chart displays the total number of Full-time students enrollment of Lincoln Land Community College and average number of community college Full-time students enrollment of Illinois by year, with the latest 2022-23 school year data.
# Part-Time Students
3,082 students
1,686 students
This chart displays the total number of Part-time students enrollment of Lincoln Land Community College and average number of community college Part-time students enrollment of Illinois by year, with the latest 2022-23 school year data.
This chart displays the Full-time students and Part-time students enrollment breakdown of Lincoln Land Community College.
This chart displays community college average Full-Time students and Part-Time students enrollment breakdown of Illinois.
# Enrollment Undergraduate
406 students
40 students
# Full-Time Undergraduate Students
1,758 students
872 students
This chart displays the total number of Full-time undergraduate students enrollment of Lincoln Land Community College and average number of community college Full-time undergraduate  students enrollment of Illinois by year, with the latest 2022-23 school year data.
# Full-Time Graduate Students
n/a
43 students
# Part-Time Undergraduate Students
3,082 students
1,719 students
# Part-Time Graduate Students
n/a
16 students
Total Dormitory Capacity
n/a
132 students
% American Indian/Alaskan
2%
5%
This chart displays the percentage of American Indian/Alaskan students in Lincoln Land Community College and the percentage of American Indian/Alaskan community college students in Illinois by year, with the latest 2022-23 school year data.
% Asian
10%
12%
This chart displays the percentage of Asian students in Lincoln Land Community College and the percentage of Asian community college students in Illinois by year, with the latest 2022-23 school year data.
% Hispanic
n/a
1%
This chart displays the percentage of Hispanic students in Lincoln Land Community College and the percentage of Hispanic community college students in Illinois by year, with the latest 2021-22 school year data.
% Black
4%
25%
This chart displays the percentage of Black students in Lincoln Land Community College and the percentage of Black community college students in Illinois by year, with the latest 2022-23 school year data.
% White
6%
4%
This chart displays the percentage of White students in Lincoln Land Community College and the percentage of White community college students in Illinois by year, with the latest 2022-23 school year data.
% Hawaiian
72%
48%
This chart displays the percentage of Hawaiian students in Lincoln Land Community College and the percentage of Hawaiian community college students in Illinois by year, with the latest 2022-23 school year data.
% Two or more races
6%
4%
This chart displays the percentage of Two or more races students in Lincoln Land Community College and the percentage of Two or more races community college students in Illinois by year, with the latest 2022-23 school year data.
% Unknown races
n/a
1%
This chart displays the percentage breakdown of students of all ethnic groups in Lincoln Land Community College.
This chart displays the percentage breakdown of students of all ethnic groups in Illinois.
Diversity Score
0.46
0.69
This chart displays the diversity score of Lincoln Land Community College and the community college average diversity score of Illinois by year, with the latest 2022-23 school year data.
College Completion Rate (Students who graduate in less than 4 years)
0.3987%
0.3913%
This chart displays completion rates for First-Time of Full-time students of Lincoln Land Community College and community college average completion rates for First-Time of Full-time students of Illinois by year, with the latest 2022-23 school year data.
College Completion Rate (Students who graduate in 4 years or more than 4 years)
n/a
0.6%
Average Graduate Earnings (10 Years)
$31,700
$31,800
This chart displays average graduate earnings (10 Years) of Lincoln Land Community College and community college average graduate earnings (10 Years) of Illinois by year, disaggregated by student subgroups with the latest 2012-13 school year data.

Tuition and Acceptance Rate

% Students Receiving Some Financial Aid
77%
82%
This chart displays the percent of students who is receiving some financial aid in Lincoln Land Community College and the percent of community college students who is receiving some financial aid in Illinois by year, with the latest 2022-23 school year data.
Median Debt for Graduates
$10,489
$8,187
This chart displays median debt for students who have completed a certificate or degree in Lincoln Land Community College and average median debt for community college students who have completed a certificate or degree in Illinois by year, with the latest 2022-23 school year data.
Median Debt for Dropouts
$5,500
$4,618
This chart displays median debt for students who have not completed a certificate or degree in Lincoln Land Community College and average median debt for community college students who have not completed a certificate or degree in Illinois by year, with the latest 2022-23 school year data.
Acceptance Rate
100%
89%
This chart displays the percent admitted of Lincoln Land Community College and the community college average percent admitted of Illinois by year, with the latest 2022-23 school year data.
SAT Reading
n/a
390
SAT Math
n/a
360
SAT Writing
n/a
355
ACT Composite
n/a
17
ACT English
n/a
17
ACT Math
n/a
17

Sports

Total Sports Offered
5 sports
Sports
Baseball, Basketball, Soccer, Softball, Volleyball
Source: 2023 (or latest year available) Integrated Postsecondary Education Data System (IPEDS) , School Administrators

School Notes

  • Make an educated decision to attend Lincoln Land Community College, the perfect place to begin your college education or obtain excellent career training. Students may choose from more than 45 associate (two-year) transfer degree programs, more than 30 occupational associate degrees, more than 15 certificates of achievement and more than 50 certificates of completion. A growing number of short-term workforce offerings can provide job skills quickly to students seeking employment. Many individuals also attend LLCC Community Education (non-credit) classes to learn new skills or pursue new interests. Students can save thousands of dollars by starting at LLCC as compared to public and private universities or technical institutes. With an 18 to 1 student/faculty ratio, LLCC professors know their students and care about their success. Student Success Coaches guide students in choosing classes, a major and career path.

Frequently Asked Questions

What is the acceptance rate of Lincoln Land Community College?
The acceptance rate of Lincoln Land Community College is 100%, which is higher than the state average of 89%.
What sports does Lincoln Land Community College offer?
Lincoln Land Community College offers 5 interscholastic sports: Baseball, Basketball, Soccer, Softball and Volleyball.

Recent Articles

What are Community Colleges Doing with Labor Department Grants?
The article explores how community colleges are utilizing Labor Department grants, particularly the TAACCCT program, to develop workforce training programs. It highlights various initiatives across different states, focusing on industry-specific training and skill development in emerging sectors.
For-Profit Universities Looking to Partner with Community Colleges
This article examines the trend of for-profit universities, particularly the University of Phoenix, seeking partnerships with community colleges. It discusses the potential benefits and controversies surrounding these collaborations, focusing on transfer agreements and workforce training programs.
New Analysis Shows How California Community Colleges Could Cut Millions in Spending
The article discusses a California Watch analysis revealing potential savings in California's community college system through administrative consolidation. It explores the implications of such cost-cutting measures and the challenges in implementing them within the state's education system.

Quick Stats (2024-25)

  • Enrollment: 4,840 students
  • Acceptance Rate: 100%
  • Student:teacher ratio: 11:1
  • Minority enrollment: 94%
  • Source: Verified school update

Related School Videos

Quick Links