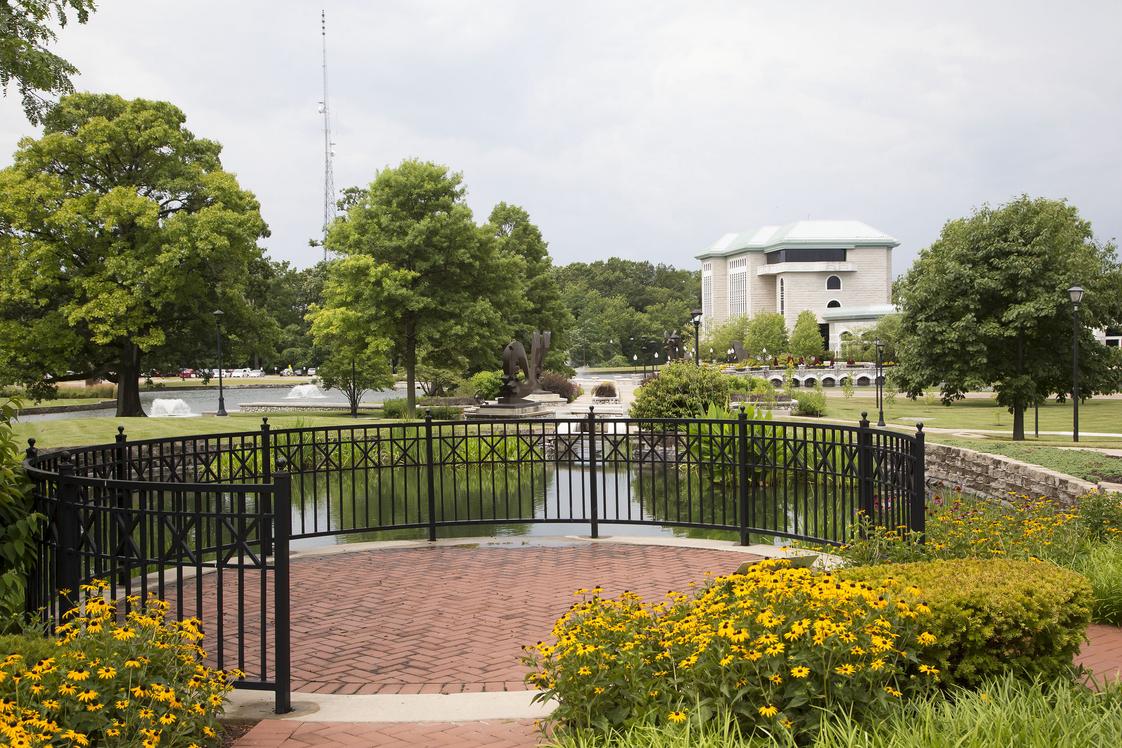
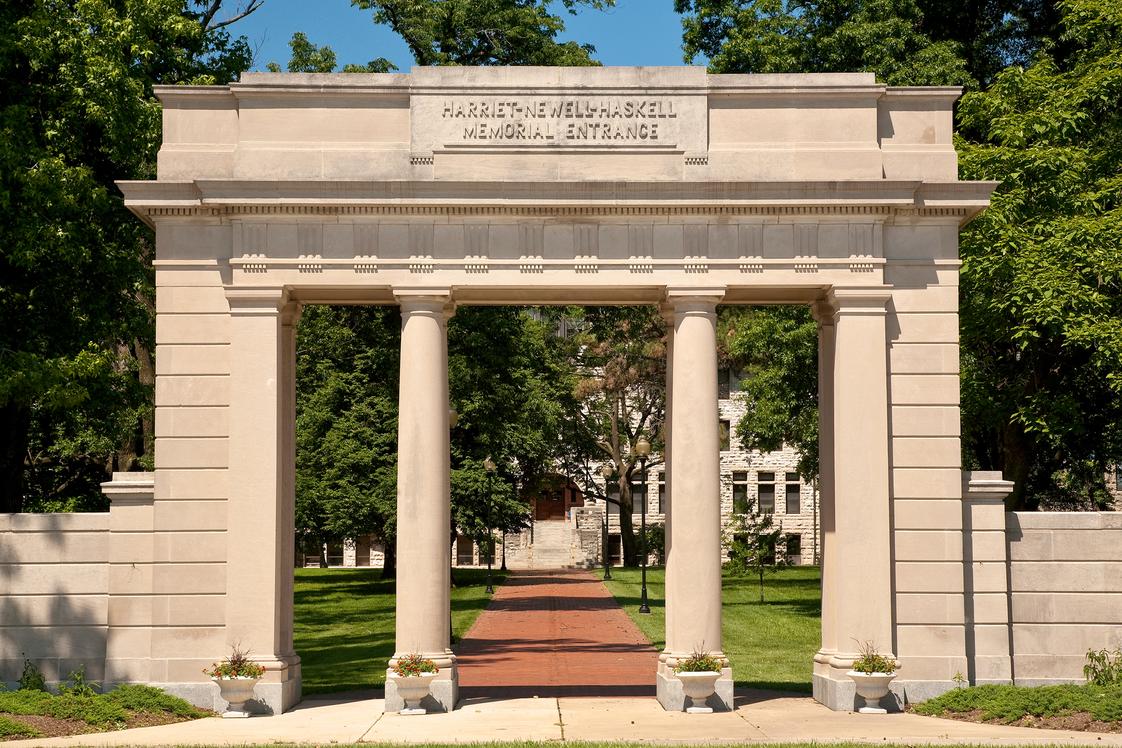
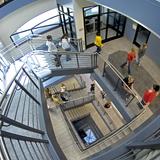
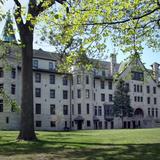
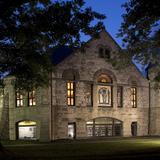
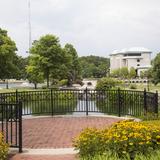
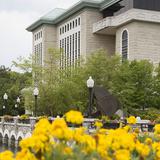
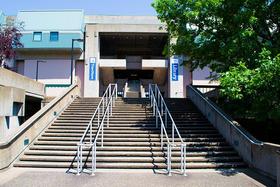
Lewis and Clark Community College Photo #7 - Pond Overlook

Lewis and Clark Community College

  • The mission of our community college is to empower people by raising aspirations and fostering achievement through dynamic, compassionate and responsible learning experiences. We offer more than 40 career programs and transfer options, College for Kids, a nationally accredited dual credit program for high school students, GED completion and workforce and safety training.

School Highlights

Lewis and Clark Community College serves 5,498 students (25% of students are full-time).
The college's student:teacher ratio of 13:1 is lower than the state community college average of 21:1.
Minority enrollment is 22% of the student body (majority Black), which is less than the state average of 53%.

Quick Stats (2025)

  • Enrollment: 5,498 students
  • In-state tuition: $9,632
  • Out-state tuition: $12,656
  • Student:teacher ratio: 13:1
  • Minority enrollment: 22%
  • Source: Verified school update

School Overview

The teacher population of 429 teachers has stayed relatively flat over five years.
Lewis and Clark Community College
(IL) Community College Avg.
Carnegie Classification
Associate's Colleges: Mixed Transfer/Career & Technical-High Nontraditional
Institution Level
At least 2 but less than 4 years
Institution Control
Public
Public
Total Faculty
429 staff
227 staff
This chart displays total faculty of Lewis and Clark Community College and community college average number of faculty in Illinois by year, with the latest 2022-23 school year data.

Student Body

The student population of Lewis and Clark Community College has declined by 14% over five years.
The student:teacher ratio of 13:1 has increased from 11:1 over five years.
The Lewis and Clark Community College diversity score of 0.38 is less than the state average of 0.69. The school's diversity has stayed relatively flat over five years.
Total Enrollment
5,498 students
3,270 students
This chart displays the total enrollment of Lewis and Clark Community College and community college average number of enrollment of Illinois by year, with the latest 2023-24 school year data.
Student : Teacher Ratio
13:1
21:1
This chart displays the student staff ratio of Lewis and Clark Community College and community college average student staff ratio of Illinois by year, with the latest 2022-23 school year data.
# Full-Time Students
1,361 students
1,007 students
This chart displays the total number of Full-time students enrollment of Lewis and Clark Community College and average number of community college Full-time students enrollment of Illinois by year, with the latest 2023-24 school year data.
# Part-Time Students
4,137 students
2,747 students
This chart displays the total number of Part-time students enrollment of Lewis and Clark Community College and average number of community college Part-time students enrollment of Illinois by year, with the latest 2023-24 school year data.
This chart displays the Full-time students and Part-time students enrollment breakdown of Lewis and Clark Community College.
This chart displays community college average Full-Time students and Part-Time students enrollment breakdown of Illinois.
# Enrollment Undergraduate
549 students
328 students
# Full-Time Undergraduate Students
1,361 students
1,007 students
This chart displays the total number of Full-time undergraduate students enrollment of Lewis and Clark Community College and average number of community college Full-time undergraduate  students enrollment of Illinois by year, with the latest 2023-24 school year data.
# Full-Time Graduate Students
n/a
43 students
# Part-Time Undergraduate Students
4,137 students
3,310 students
# Part-Time Graduate Students
n/a
18 students
Total Dormitory Capacity
n/a
132 students
% American Indian/Alaskan
n/a
n/a
This chart displays the percentage of American Indian/Alaskan students in Lewis and Clark Community College and the percentage of American Indian/Alaskan community college students in Illinois by year, with the latest 2023-24 school year data.
% Asian
1%
6%
This chart displays the percentage of Asian students in Lewis and Clark Community College and the percentage of Asian community college students in Illinois by year, with the latest 2022-23 school year data.
% Hispanic
3%
26%
This chart displays the percentage of Hispanic students in Lewis and Clark Community College and the percentage of Hispanic community college students in Illinois by year, with the latest 2021-22 school year data.
% Black
8%
13%
This chart displays the percentage of Black students in Lewis and Clark Community College and the percentage of Black community college students in Illinois by year, with the latest 2022-23 school year data.
% White
78%
47%
This chart displays the percentage of White students in Lewis and Clark Community College and the percentage of White community college students in Illinois by year, with the latest 2022-23 school year data.
% Hawaiian
n/a
n/a
This chart displays the percentage of Hawaiian students in Lewis and Clark Community College and the percentage of Hawaiian community college students in Illinois by year, with the latest 2023-24 school year data.
% Two or more races
3%
3%
% Non Resident races
n/a
1%
% Unknown races
6%
4%
This chart displays the percentage breakdown of students of all ethnic groups in Lewis and Clark Community College.
This chart displays the percentage breakdown of students of all ethnic groups in Illinois.
Diversity Score
0.38
0.69
This chart displays the diversity score of Lewis and Clark Community College and the community college average diversity score of Illinois by year, with the latest 2022-23 school year data.
College Completion Rate (Students who graduate in less than 4 years)
0.4283%
0.4%
This chart displays completion rates for First-Time of Full-time students of Lewis and Clark Community College and community college average completion rates for First-Time of Full-time students of Illinois by year, with the latest 2023-24 school year data.
College Completion Rate (Students who graduate in 4 years or more than 4 years)
n/a
0.38%
Average Graduate Earnings (10 Years)
$29,500
$31,800
This chart displays average graduate earnings (10 Years) of Lewis and Clark Community College and community college average graduate earnings (10 Years) of Illinois by year, disaggregated by student subgroups with the latest 2012-13 school year data.

Tuition and Acceptance Rate

The public in-state tuition of $9,632 is more than the state average of $7,875. The in-state tuition has declined by 13% over four years.
The public out-state tuition of $12,656 is more than the state average of $10,847. The out-state tuition has declined by 13% over four years.
In-State Tuition Fees
$9,632
$7,875
This chart displays tuition fees for an in-state student of Lewis and Clark Community College and the public community college average tuition fees for an in-state student of Illinois by year, with the latest 2023-24 school year data.
Out-State Tuition Fees
$12,656
$10,847
This chart displays tuition fees for an out-of-state student of Lewis and Clark Community College and the public community college average tuition fees for an out-of-state student of Illinois by year, with the latest 2023-24 school year data.
Tuition Notes
Substantial discount
% Students Receiving Some Financial Aid
64%
82%
This chart displays the percent of students who is receiving some financial aid in Lewis and Clark Community College and the percent of community college students who is receiving some financial aid in Illinois by year, with the latest 2022-23 school year data.
Median Debt for Graduates
$6,750
$8,187
This chart displays median debt for students who have completed a certificate or degree in Lewis and Clark Community College and average median debt for community college students who have completed a certificate or degree in Illinois by year, with the latest 2022-23 school year data.
Median Debt for Dropouts
$3,574
$4,618
This chart displays median debt for students who have not completed a certificate or degree in Lewis and Clark Community College and average median debt for community college students who have not completed a certificate or degree in Illinois by year, with the latest 2022-23 school year data.
Acceptance Rate
n/a
89%
SAT Reading
n/a
390
SAT Math
n/a
360
SAT Writing
n/a
355
ACT Composite
n/a
17
ACT English
n/a
17
ACT Math
n/a
17

Sports

Total Sports Offered
7 sports
Sports
Baseball, Basketball, Golf, Soccer, Softball, Tennis, Volleyball

Extracurriculars

Total ExtracurricularsTotal Extra-curric.
28 extracurriculars
ExtracurricularsExtra-curric.
Club or Organization:
A Cross Between Campus Ministry, American Institute of Architecture Students (AIAS), Association of Information Technology Professionals, Automotive Technology Organization, Biology Club, Black Student Association, Business of Comedy, Dental Assisting Club, Drafting Engineering & Mechanical (DEMO), International Student Association, L&C Student Chapter of the American Welding Society, LC Pride, Multicultural Student Society, Nursing Club, Occupational Therapy Assistants, OTA Honor Society, Phi Theta Kappa Honor Society, Processing Operations Technology Club (PTEC), Psychology Club, Radio Broadcasting (WLCA), Science Technology Engineering & Math (STEM), Student Activities, Student Dental Hygienists, Student Government Association (SGA), Student Sustainability Association, The Bridge (Student Newspaper), United Nerds of LC (UNLC), Veterans Club
Source: 2024 (or latest year available) Integrated Postsecondary Education Data System (IPEDS) , School Administrators

School Notes

  • Lewis and Clark Community College is a two-year higher education institution with multiple campuses, a river research center, a global humanities center, a training center, an adult education center and Community Education Centers dedicated to empowering people throughout the college district, which encompasses more than 220,000 people.

    The college`s offerings run the gamut, from more than 40 career programs and transfer options to College for Kids, a nationally accredited dual credit program for high school students, GED completion and workforce and safety training.A national and state award-winning standout among Illinois community colleges, L&C was founded in 1970 and currently serves approximately 15,000 students annually. The college employs more than 660 employees and adds $369.4 million in regional income annually, which represents 4.7 percent of the region`s GRP.

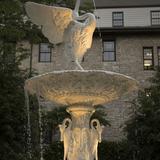
    The Godfrey Campus is unique, known for its beautiful, historic location on the grounds of the former Monticello College, the second oldest all-female college in the nation, founded in 1838. The campus features the Monticello Sculpture Gardens, a botanic garden which comprises 14 eye-catching sculptures and multiple fountains, and is a Signature Garden site for the Missouri Botanical Garden. The campus welcomes more than 200,000 visitors to campus every year.

    The historic N.O. Nelson Campus, a former industrial complex in Edwardsville`s Leclaire neighborhood, is now home to the college`s Process Operations Technology and Instrumentation and Control Systems programs, as well as the St. Louis Confluence Fab Lab and the Leclaire Room, which is used for numerous community events. The campus is utilized by more than 1,500 students.

    Lewis and Clark is dedicated to public engagement, from reducing the college`s carbon footprint and encouraging sustainable practices and education, to delivering affordable healthcare to underserved populations through a Mobile Health Unit and an interprofessional, federally funded Family Health Clinic - still the only nurse managed clinic operated by a community college.

Frequently Asked Questions

How much does Lewis and Clark Community College cost?
Lewis and Clark Community College's tuition is approximately $9,632 for In-State students and $12,656 for Out-State students.
What sports does Lewis and Clark Community College offer?
Lewis and Clark Community College offers 7 interscholastic sports: Baseball, Basketball, Golf, Soccer, Softball, Tennis and Volleyball.

Recent Articles

First Responders and Emergency Services: Specialized Roles and Training 
This comprehensive guide explores the evolving landscape of emergency services, highlighting key positions in firefighting, EMS, law enforcement, and specialized response teams. It emphasizes the growing demand for skilled professionals due to increasing environmental and security challenges, and outlines the crucial role of community colleges in providing necessary training and certifications.
Unlocking Airport Career Opportunities: Your Guide to Ground Jobs
Discover the diverse range of ground jobs at mid-size U.S. airports, their educational requirements, and how community colleges can prepare you for these exciting careers.
Adult Learners: Upgrading Your Skills
We offer straightforward advice on identifying transferable skills, exploring job opportunities, leveraging community resources, and embracing lifelong learning. With relatable examples and encouragement, this guide aims to empower readers to navigate the job market confidently and successfully transition into new careers.

Quick Stats (2025)

  • Enrollment: 5,498 students
  • In-state tuition: $9,632
  • Out-state tuition: $12,656
  • Student:teacher ratio: 13:1
  • Minority enrollment: 22%
  • Source: Verified school update

Related School Videos

Did You Know?

For Illinois public community colleges, the average tuition is approximately $7,875 per year for in-state students and $10,847 for out-of-state students. For private community colleges, the average yearly tuition is approximately $14,511 per year. Read more about average community college tuition costs across the country.

The average community college acceptance rate in Illinois is 87%. Read more about national community college acceptance rates.

Illinois community colleges have a diversity score of 0.69, which is higher than the national average of 0.00. The most diverse community college in Illinois is Toyota Technological Institute at Chicago. Read more about community college diversity statistics in the USA.

Quick Links