- Located in a quiet, relaxed setting between Pittsburgh and Erie, with modern facilities and commercial training labs. Programs are 12 months in-house and 3 month off-site externships worked among top job demand areas according to US Bureau of Labor Statistics. Small lab classes with practical technical education taught in accordance with industry standards, career focused and skill specific.
Quick Stats (2025)
- Source: Integrated Postsecondary Education Data System (IPEDS)
School Overview
Winner Institute of Arts & Sciences
(PA) Community College Avg.
Carnegie Classification
Associates--Private Not-for-profit
Baccalaureate/Associate's Colleges: Mixed Baccalaureate/Associate's
Institution Level
Less than 2 yrs
At least 2 but less than 4 years
Institution Control
Public
Private not-for-profit
Total Faculty
n/a
58 staff
Student Body
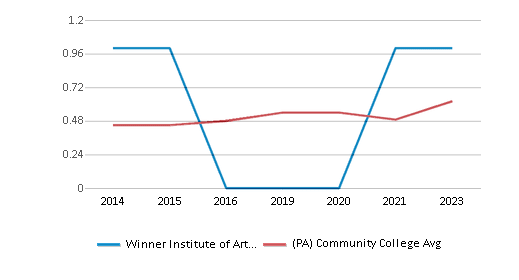
The Winner Institute of Arts & Sciences diversity score of 1.00 is more than the state average of 0.68. The school's diversity has stayed relatively flat over five years.
Total Enrollment
n/a
361 students
Student : Teacher Ratio
n/a
15:1
# Full-Time Students
n/a
310 students
# Part-Time Students
n/a
134 students
# Enrollment Undergraduate
n/a
300 students
# Full-Time Undergraduate Students
n/a
300 students
# Full-Time Graduate Students
n/a
10 students
# Part-Time Undergraduate Students
n/a
134 students
# Part-Time Graduate Students
n/a
12 students
Total Dormitory Capacity
n/a
330 students
% Asian
n/a
5%
% Hispanic
n/a
11%
% Black
n/a
15%
% White
n/a
52%
% Hawaiian
n/a
3%
% Two or more races
n/a
3%
% Non Resident races
n/a
1%
% Unknown races
100%
10%
Diversity Score
n/a
0.68

College Completion Rate (Students who graduate in less than 4 years)
n/a
0.6111%
College Completion Rate (Students who graduate in 4 years or more than 4 years)
n/a
0.3822%
Tuition and Acceptance Rate
% Students Receiving Some Financial Aid
n/a
91%
Median Debt for Graduates
n/a
$13,620
Median Debt for Dropouts
n/a
$6,234
Acceptance Rate
n/a
78%
SAT Reading
n/a
460
SAT Math
n/a
470
SAT Writing
n/a
435
ACT Composite
n/a
20
ACT English
n/a
20
ACT Math
n/a
21
ACT Writing
n/a
7
Source: 2023 (or latest year available) Integrated Postsecondary Education Data System (IPEDS)
Recent Articles

Retrain For A New Career In Weeks? Yes!
In as little as three weeks, you could be retrained for a new job through community colleges. Learn about the retraining programs available and how quickly you can gain new skills.

Why Low-Income Community College Students Achieve Success at Universities
Overcoming the odds, low-income community college students are poised to become top performers once they transfer to a four-year university. Learn about the new study that has identified the successful qualities of low-income community college students.

Why Accreditation Matters: Securing Your Educational Investment and Future Career
Accreditation is crucial for college selection, affecting financial aid eligibility, credit transferability, and future employment prospects. This article explains the importance of choosing an accredited institution and provides resources for verifying a school's accreditation status.


