


- 1.testingg
- 2.Do notinput any commas, decimals, or dashes (please round decimals).
- 3.testing
- 4.Fields left empty will not be shown or will output as "n/a" on your profile.
- 5. Testing 123456
- ASASDA
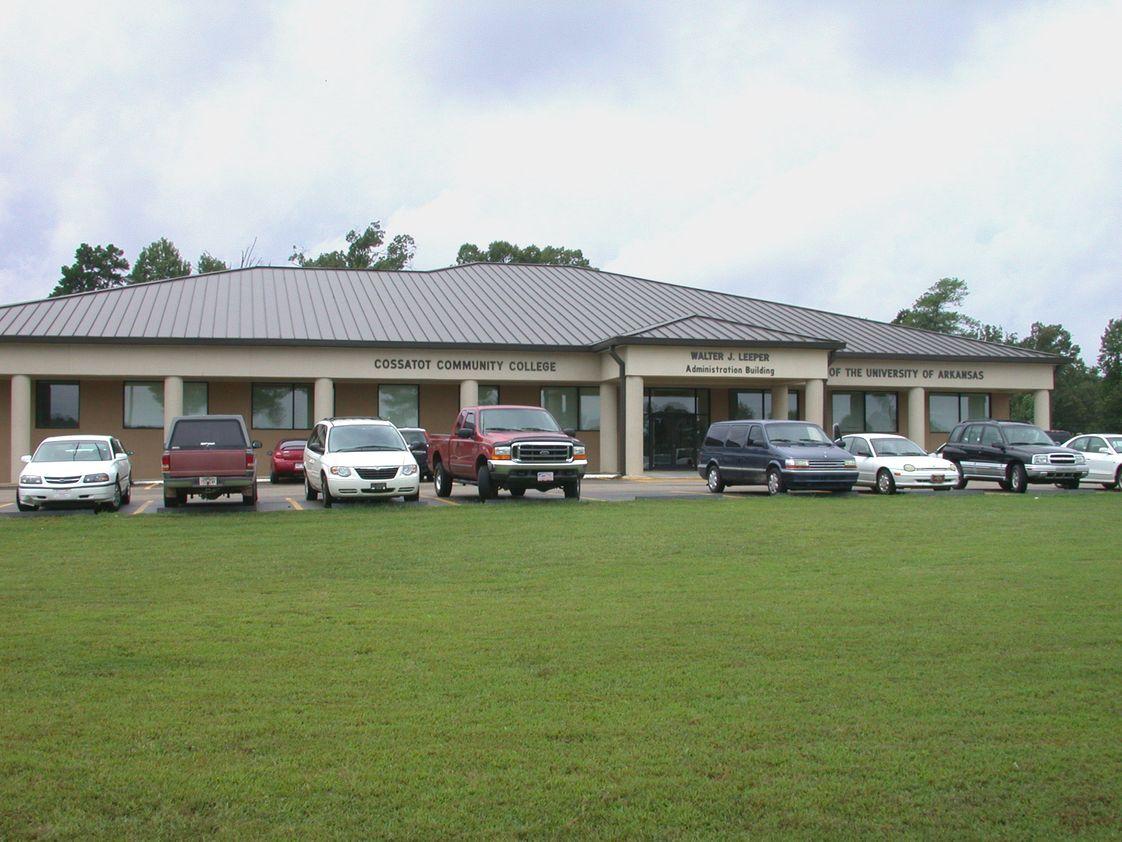
- https://www.communitycollegereview.com/
- 6. Testingg
School Highlights
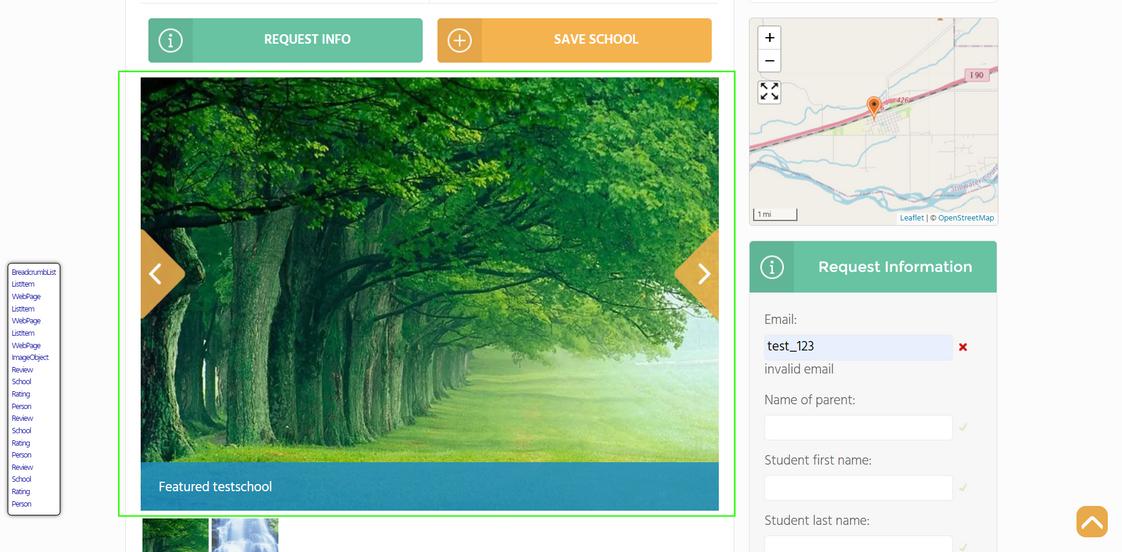
Test school123 serves 1 students (600% of students are full-time).
The college's student-teacher ratio of 1:1 is lower than the state community college average of 13:1.
Minority enrollment is 100% of the student body (majority Asian), which is less than the state average of 62%.
Quick Facts (2025-26)
- Enrollment: 1 students
- Private-state tuition: $1,233
- Acceptance Rate: 4%
- Student-teacher ratio: 1:1
- Minority enrollment: 100%
- Source: Verified school update
Upcoming Events and News
- Open House - Mon., December 07, 2020 - Wed., December 08, 2027 - get more information!
- Community College Fair - Mon., December 07, 2020 - Fri., December 08, 2028 - get more information!
- Virtual Event - Mon., December 07, 2020 - Tue., December 08, 2026 9:00am (MST) - get more information!
- Recruiting Fair - Sat., December 12, 2020 - Mon., December 13, 2027 - get more information!
- Virtual Event - Tue., February 02, 2021 - Tue., February 03, 2026 9:00am (MST) - get more information!
- Open House - Sat., April 01, 2023 - Mon., August 03, 2026 - get more information!
- ...read more
- test - 07/29/202112
- testing - 01/06/2021testing functionality
- Testing functionality - 07/10/2020567
- test news with 's - 07/10/2020test news with 's
- parimal news - 04/06/2018test
- test 11 - 04/06/2018qwsqq
- testmrch - 03/21/2017123
- testing - 02/09/2017Testing of a site
- ...read more
Top Rankings
Test school123 ranks among the top 20% of public schools in New York for:
Category
Attribute
Affordability
School Overview
The teacher population of 1 teachers has declined by 96% over five years.
Test school123
(NY) Community College Avg.
Carnegie Classification
Special Focus Two-Year: Arts & Design
Baccalaureate/Associate's Colleges: Mixed Baccalaureate/Associate's
Institution Level
4 or more years
At least 2 but less than 4 years
Institution Control
Private, for profit
Private not-for-profit
Total Faculty
1 staff
159 staff
Number of Programs Offered
2
20
Student Body
The student population of Test school123 has declined by 99% over five years.
The student-teacher ratio of 1:1 has decreased from 5:1 over five years.
The Test school123 diversity score of 0.50 is less than the state average of 0.76. The school's diversity has grown by 10% over five years.
Total Enrollment
1 students
1,129 students
Student-Teacher Ratio
1:1
13:1
# Full-Time Students
6 students
528 students
# Part-Time Students
2 students
601 students
# Enrollment Undergraduate
n/a
357 students
# Full-Time Undergraduate Students
32 students
519 students
# Full-Time Graduate Students
4 students
44 students
# Part-Time Undergraduate Students
n/a
850 students
# Part-Time Graduate Students
n/a
41 students
Total Dormitory Capacity
n/a
382 students
% American Indian/Alaskan
45%
n/a
% Asian
55%
8%
% Hispanic
n/a
23%
% Black
n/a
18%
% White
n/a
38%
% Hawaiian
n/a
2%
% Two or more races
n/a
3%
% Non Resident races
n/a
3%
% Unknown races
n/a
5%
Diversity Score
0.50
0.76
College Completion Rate (Students who graduate in less than 4 years)
n/a
33%
College Completion Rate (Students who graduate in 4 years or more than 4 years)
n/a
40%
Tuition and Acceptance Rate
The private state tuition of $3,444 is less than the state average of $16,503.
Private State Tuition Fees
$1,233
$16,503
Tuition Notes
Central to the mission of Brandeis Marin is a commitment to provide a quality education to a diverse population of qualified students. Our Tuition Assistance program ensures that Brandeis Marin remains accessible to families with a wide range of economic Central to the mission of Brandeis Marin is a commitment to provide a quality education to a diverse population of qualified students. Our Tuition Assistance program ensures that Brandeis Marin remains accessible to families with a wide range of economic.
% Students Receiving Some Financial Aid
7%
88%
Median Debt for Graduates
n/a
$13,841
Median Debt for Dropouts
n/a
$5,500
Acceptance Rate
4%
73%
SAT Total Avg.
28
475
SAT Reading
28
475
SAT Math
32
496
SAT Writing
51
410
ACT Total Avg.
39
20
ACT Composite
55
21
ACT English
61
19
ACT Math
39
20
Sports
Total Sports Offered
6 sports
Sports
Alpine SkiingCurling
FencingFootball
GymnasticsMarksmanship
Extracurriculars
Total ExtracurricularsTotal Extra-curric.
87 extracurriculars
ExtracurricularsExtra-curric.
Club or Organization:
Arts and Music Programs:
Recreational Athletic Programs:
3D Printing ClubAcademy Manor Nursing Home volunteers
ActiveMinds AndoverActivism
AdoptaPlatoonAfro-Latino-American Society (Af-Lat-Am)
Alianza (Latino Student Alliance)Amnesty International Club
and Mentoring (DREAM)Andover Ambassadors
Andover Japanese ConnectionApp Development
ARC BuddiesArchaeology and History Club
Asian SocietyAstronomy Club
Babel Foreign Language MagazineBacktracks Magazine
Baking ClubBancroft Elementary Teachers Aides
Big Idea ClubBirding Club
Blue Key SocietyBoss Magazine
Bread & Roses community kitchen volunteersBread Loaf Pen Pel Program
Bread Loaf Writing WorkshopCalliope (female a capella)
Campuses against CancerCatholic Student Fellowship
Chess ClubChinese Language & Culture Club
Chinese Taiwanese Student AssociationChristian Fellowship Club
Classical Physics ClubClassics Club
Clutch CollaborativeCommunity Awareness For Everyone (CAFE)
Computer Science ClubConstructed Languages Club
Arts and Music Programs:
Andover Art SocietyAndover-Lawrence String Program
Architecture ClubArt Exchange
Art for ExpressionArt Music Society
Azureblue.print
Classical Music ForumDJ Factory-Electronic Music Production
DramaLabsDrum Line
Footnotes tap dance groupFrisbee Club
GospelHandbell Choir
HypnotiqMusic MDs
Unaccompanied MinorsUnder the Bed
Yorkies
Recreational Athletic Programs:
Ballroom Dance SocietyBlue Strut
Cluster Ultimate FrisbeeCoed Crew
Cross CountryDance Instruction
Disc GolfDouble Dutch
Fencing ClubFIT (Fundamentals in Training)
Hip Hop ClubInstructional Swim
Intramural HockeyIntramural Sports
Outdoor PursuitsPaddle Tennis Club
PilatesPing Pong Club
SkatingSLAM cheer team
SpinningSports and Games Club
Squash instructionTennis Instruction
Volleyball InstructionYoga
Source: 2023 (or latest year available) Integrated Postsecondary Education Data System (IPEDS) , School Administrators
School Notes
- School Mascot: Eagle Beakers
- Sample of notable school alumni/alumnae:
- Alumni name 1's - Alumni Description 1's
- Alumni name 2's - Alumni Description 2's
- Test1 - சமூக கல்லூரியை சோதிக்கிறது
- Test2 - การทดสอบวิทยาลัยชุมชน
Profile last updated: 06/24/2025
Frequently Asked Questions
How much does Test school123 cost?
Test school123's private state tuition is approximately $1,233.
What is the acceptance rate of Test school123?
The acceptance rate of Test school123 is 4%, which is lower than the state average of 73%.
Who are famous alumni from Test school123?
Test school123 famous alumni include: Alumni name 1's, Alumni name 2's, Test1 and Test2.
What sports does Test school123 offer?
Test school123 offers 6 interscholastic sports: Alpine Skiing, Curling, Fencing, Football, Gymnastics and Marksmanship.
What is Test school123's ranking?
Test school123 ranks among the top 20% of community college in New York for: Least expensive tuition and Average community college minority breakdown.
Recent Articles

Scholarships for Community College Students 2025
Explore updated scholarship programs, tuition data, and expert strategies for community college students in 2025.

The Rise of Technical and Vocational Training in 2025
Explore the 2025 surge in technical and vocational training—enrollment, policy, costs, and why this path is gaining ground for students and parents.

Stackable Credentials: How Community Colleges Advance Careers
Discover how community colleges use stackable credentials to build career pathways, boost earnings, and enable lifelong learning in 2025.


