Tennessee College of Applied Technology-Morristown

School Highlights

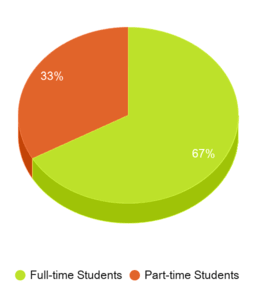
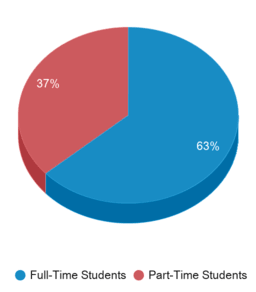
Tennessee College of Applied Technology-Morristown serves 787 students (67% of students are full-time).
Minority enrollment is 97% of the student body (majority Black), which is more than the state average of 94%.

Quick Stats (2024-25)

  • Enrollment: 787 students
  • Minority enrollment: 97%
  • Source: Integrated Postsecondary Education Data System (IPEDS)

School Overview

Tennessee College of Applied Technology-Morristown
(TN) Community College Avg.
Carnegie Classification
Not applicable, not in Carnegie universe (not accredited or nondegree-granting)
Institution Level
At least 2 but less than 4 years
Institution Control
Public
Public
Total Faculty
n/a
81 staff

Student Body

The student population of Tennessee College of Applied Technology-Morristown has stayed relatively flat over five years.
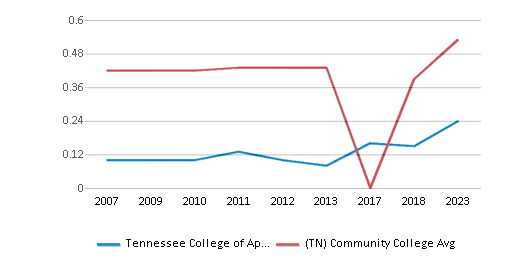
The Tennessee College of Applied Technology-Morristown diversity score of 0.24 is less than the state average of 0.53. The school's diversity has grown by 139% over five years.
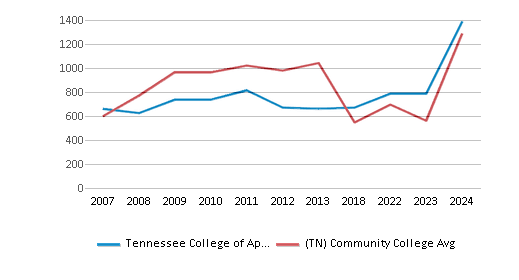
Total Enrollment
787 students
592 students
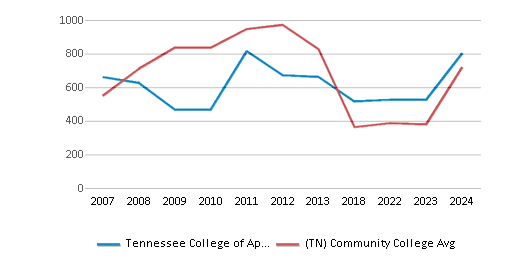
This chart displays the total enrollment of Tennessee College of Applied Technology-Morristown and community college average number of enrollment of Tennessee by year, with the latest 2022-23 school year data.
Student : Teacher Ratio
n/a
14:1
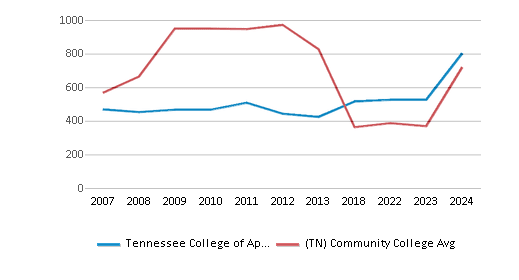
# Full-Time Students
526 students
369 students
This chart displays the total number of Full-time students enrollment of Tennessee College of Applied Technology-Morristown and average number of community college Full-time students enrollment of Tennessee by year, with the latest 2022-23 school year data.
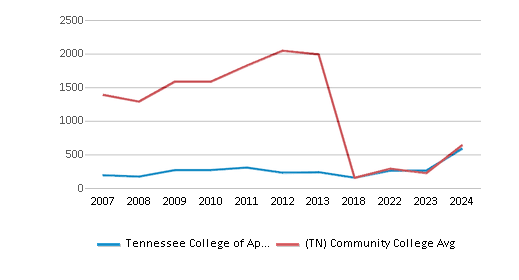
# Part-Time Students
261 students
223 students
This chart displays the total number of Part-time students enrollment of Tennessee College of Applied Technology-Morristown and average number of community college Part-time students enrollment of Tennessee by year, with the latest 2022-23 school year data.
This chart displays the Full-time students and Part-time students enrollment breakdown of Tennessee College of Applied Technology-Morristown.
This chart displays community college average Full-Time students and Part-Time students enrollment breakdown of Tennessee.
# Enrollment Undergraduate
n/a
406 students
# Full-Time Undergraduate Students
526 students
379 students
This chart displays the total number of Full-time undergraduate students enrollment of Tennessee College of Applied Technology-Morristown and average number of community college Full-time undergraduate  students enrollment of Tennessee by year, with the latest 2022-23 school year data.
# Full-Time Graduate Students
n/a
8 students
# Part-Time Undergraduate Students
261 students
290 students
# Part-Time Graduate Students
n/a
20 students
Total Dormitory Capacity
n/a
195 students
% American Indian/Alaskan
n/a
2%
% Asian
2%
17%
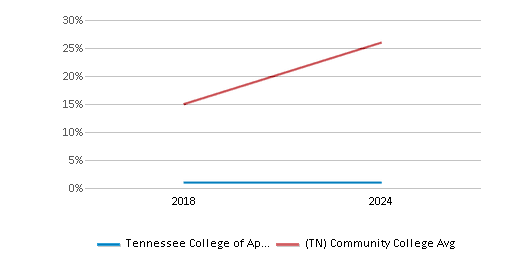
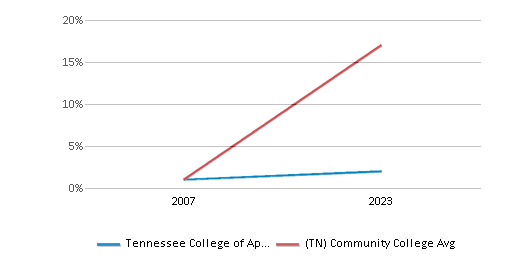
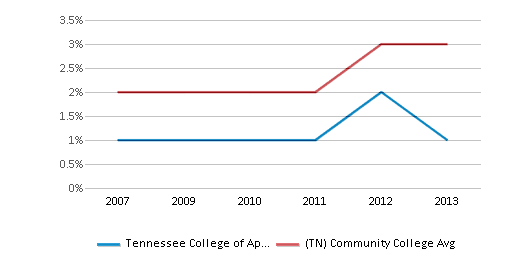
This chart displays the percentage of Asian students in Tennessee College of Applied Technology-Morristown and the percentage of Asian community college students in Tennessee by year, with the latest 2022-23 school year data.
% Hispanic
n/a
n/a
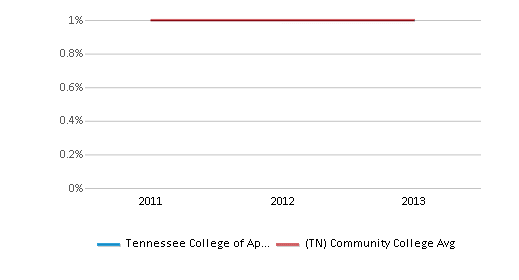
This chart displays the percentage of Hispanic students in Tennessee College of Applied Technology-Morristown and the percentage of Hispanic community college students in Tennessee by year, with the latest 2012-13 school year data.
% Black
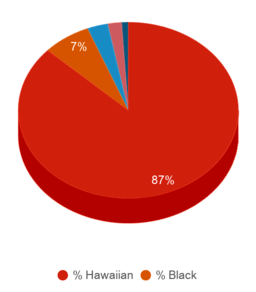
7%
7%
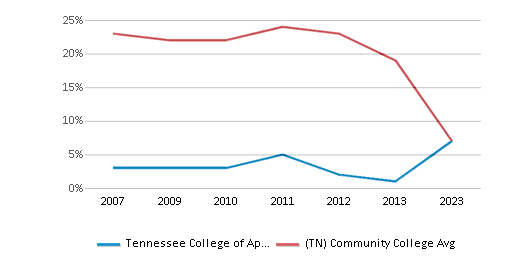
This chart displays the percentage of Black students in Tennessee College of Applied Technology-Morristown and the percentage of Black community college students in Tennessee by year, with the latest 2022-23 school year data.
% White
3%
6%
This chart displays the percentage of White students in Tennessee College of Applied Technology-Morristown and the percentage of White community college students in Tennessee by year, with the latest 2022-23 school year data.
% Hawaiian
87%
66%
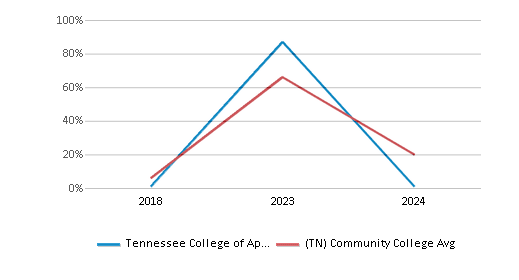
This chart displays the percentage of Hawaiian students in Tennessee College of Applied Technology-Morristown and the percentage of Hawaiian community college students in Tennessee by year, with the latest 2022-23 school year data.
% Two or more races
n/a
2%
This chart displays the percentage of Two or more races students in Tennessee College of Applied Technology-Morristown and the percentage of Two or more races community college students in Tennessee by year, with the latest 2012-13 school year data.
% Unknown races
1%
n/a
This chart displays the percentage breakdown of students of all ethnic groups in Tennessee College of Applied Technology-Morristown.
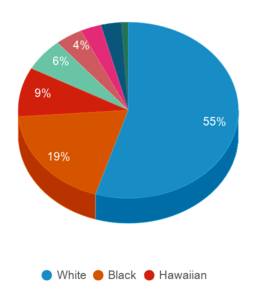
This chart displays the percentage breakdown of students of all ethnic groups in Tennessee.
Diversity Score
0.24
0.53
This chart displays the diversity score of Tennessee College of Applied Technology-Morristown and the community college average diversity score of Tennessee by year, with the latest 2022-23 school year data.
College Completion Rate (Students who graduate in less than 4 years)
0.6401%
0.5824%
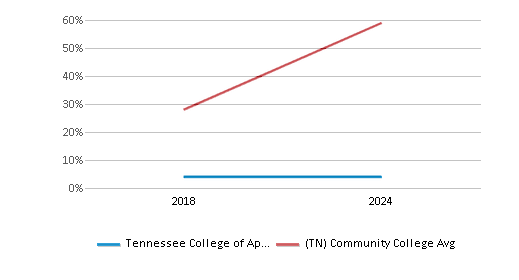
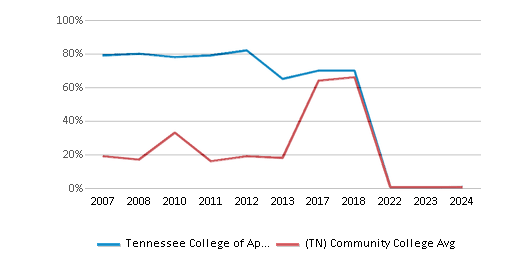
This chart displays completion rates for First-Time of Full-time students of Tennessee College of Applied Technology-Morristown and community college average completion rates for First-Time of Full-time students of Tennessee by year, with the latest 2022-23 school year data.
College Completion Rate (Students who graduate in 4 years or more than 4 years)
n/a
0.3772%
Average Graduate Earnings (10 Years)
$28,400
$29,000
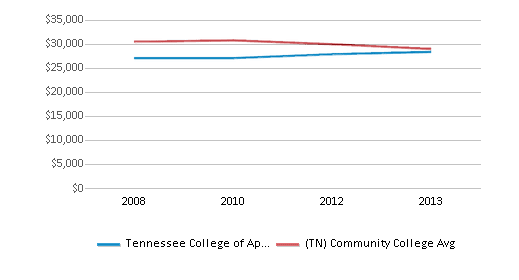
This chart displays average graduate earnings (10 Years) of Tennessee College of Applied Technology-Morristown and community college average graduate earnings (10 Years) of Tennessee by year, disaggregated by student subgroups with the latest 2012-13 school year data.

Tuition and Acceptance Rate

% Students Receiving Some Financial Aid
97%
97%
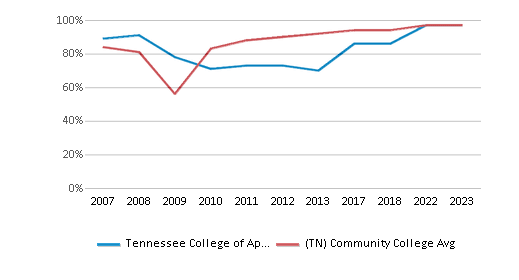
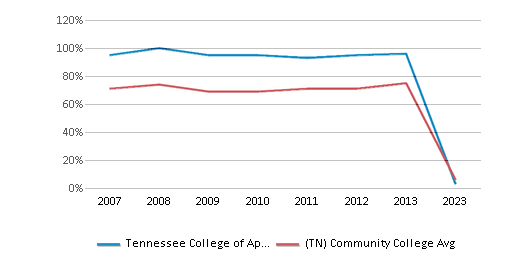
This chart displays the percent of students who is receiving some financial aid in Tennessee College of Applied Technology-Morristown and the percent of community college students who is receiving some financial aid in Tennessee by year, with the latest 2022-23 school year data.
Median Debt for Graduates
n/a
$11,730
Median Debt for Dropouts
n/a
$5,250
Acceptance Rate
n/a
83%
SAT Reading
n/a
415
SAT Math
n/a
455
SAT Writing
n/a
469
ACT Composite
n/a
20
ACT English
n/a
19
ACT Math
n/a
19
Source: 2023 (or latest year available) Integrated Postsecondary Education Data System (IPEDS)
Profile last updated: 08/14/2024

Recent Articles

What is a Community College?
This comprehensive guide explains what a community college is, its history, and its role in higher education. It covers the types of programs offered, differences from four-year colleges, benefits of attending, and important considerations for prospective students, providing valuable insights for those exploring educational options.
Value of an Associates vs. Bachelors Degree
This comprehensive guide compares the value of associate's and bachelor's degrees, exploring factors such as program length, cost, earning potential, and career opportunities. It provides valuable insights for students deciding between these two educational paths, emphasizing the importance of aligning degree choice with personal and professional goals.
How to Earn Your GED and College Degree Simultaneously
This comprehensive guide explores how students can earn their GED and college degree simultaneously through community college programs. It discusses the economic benefits, admission requirements, and steps to enroll in such programs, providing valuable information for those seeking to advance their education and career prospects.

Quick Stats (2024-25)

  • Enrollment: 787 students
  • Minority enrollment: 97%
  • Source: Integrated Postsecondary Education Data System (IPEDS)

Quick Links