Tennessee College of Applied Technology-Hartsville

716 McMurry Blvd East
Hartsville, TN 37074
Top Ranked (2025): View Rankings

School Highlights

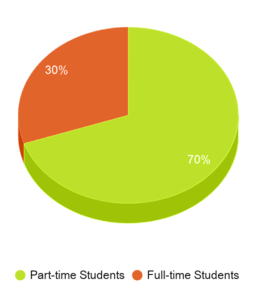
Tennessee College of Applied Technology-Hartsville serves 696 students (30% of students are full-time).
Minority enrollment is 97% of the student body (majority Asian), which is more than the state average of 45%.

Quick Stats (2025)

  • Enrollment: 696 students
  • Minority enrollment: 97%
  • Source: Integrated Postsecondary Education Data System (IPEDS)

Top Rankings

Tennessee College of Applied Technology-Hartsville ranks among the top 20% of public schools in Tennessee for:

School Overview

Tennessee College of Applied Technology-Hartsville
(TN) Community College Avg.
Carnegie Classification
Not applicable, not in Carnegie universe (not accredited or nondegree-granting)
Institution Level
At least 2 but less than 4 years
Institution Control
Public
Public
Total Faculty
n/a
81 staff

Student Body

The student population of Tennessee College of Applied Technology-Hartsville has grown by 50% over five years.
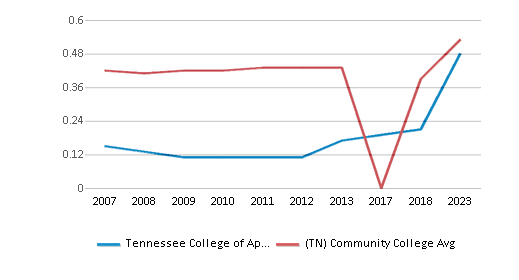
The Tennessee College of Applied Technology-Hartsville diversity score of 0.48 is less than the state average of 0.65. The school's diversity has grown by 182% over five years.
Total Enrollment
696 students
605 students
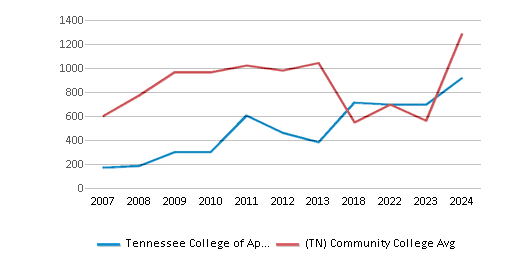
This chart displays the total enrollment of Tennessee College of Applied Technology-Hartsville and community college average number of enrollment of Tennessee by year, with the latest 2023-24 school year data.
Student : Teacher Ratio
n/a
18:1
# Full-Time Students
210 students
400 students
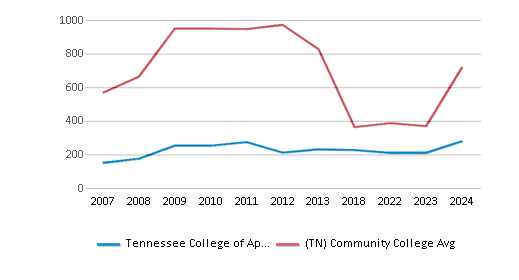
This chart displays the total number of Full-time students enrollment of Tennessee College of Applied Technology-Hartsville and average number of community college Full-time students enrollment of Tennessee by year, with the latest 2023-24 school year data.
# Part-Time Students
486 students
230 students
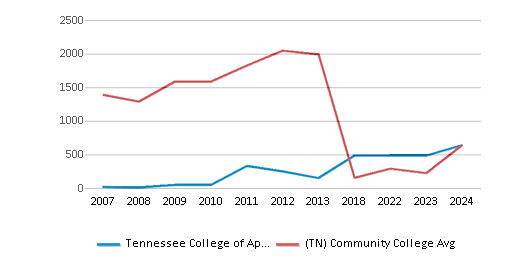
This chart displays the total number of Part-time students enrollment of Tennessee College of Applied Technology-Hartsville and average number of community college Part-time students enrollment of Tennessee by year, with the latest 2023-24 school year data.
This chart displays the Full-time students and Part-time students enrollment breakdown of Tennessee College of Applied Technology-Hartsville.
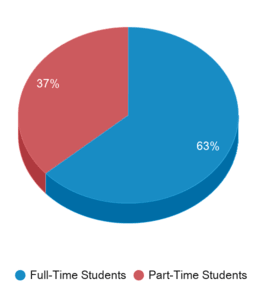
This chart displays community college average Full-Time students and Part-Time students enrollment breakdown of Tennessee.
# Enrollment Undergraduate
n/a
504 students
# Full-Time Undergraduate Students
210 students
400 students
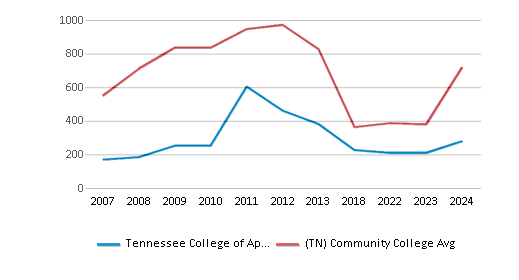
This chart displays the total number of Full-time undergraduate students enrollment of Tennessee College of Applied Technology-Hartsville and average number of community college Full-time undergraduate  students enrollment of Tennessee by year, with the latest 2023-24 school year data.
# Full-Time Graduate Students
n/a
12 students
# Part-Time Undergraduate Students
486 students
335 students
# Part-Time Graduate Students
n/a
12 students
Total Dormitory Capacity
n/a
195 students
% Asian
5%
4%
% Hispanic
n/a
6%
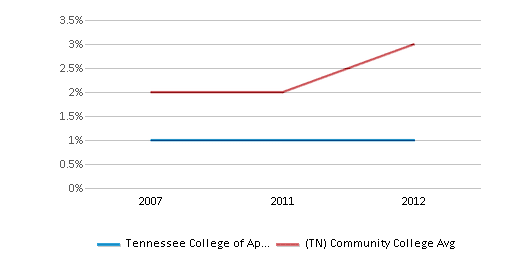
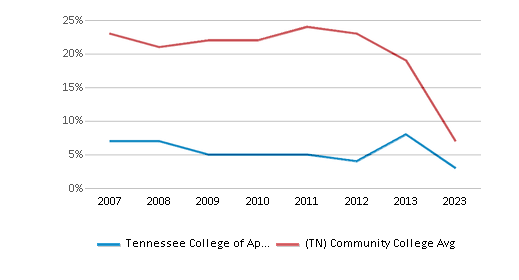
This chart displays the percentage of Hispanic students in Tennessee College of Applied Technology-Hartsville and the percentage of Hispanic community college students in Tennessee by year, with the latest 2011-12 school year data.
% Black
3%
19%
This chart displays the percentage of Black students in Tennessee College of Applied Technology-Hartsville and the percentage of Black community college students in Tennessee by year, with the latest 2022-23 school year data.
% White
3%
55%
This chart displays the percentage of White students in Tennessee College of Applied Technology-Hartsville and the percentage of White community college students in Tennessee by year, with the latest 2022-23 school year data.
% Hawaiian
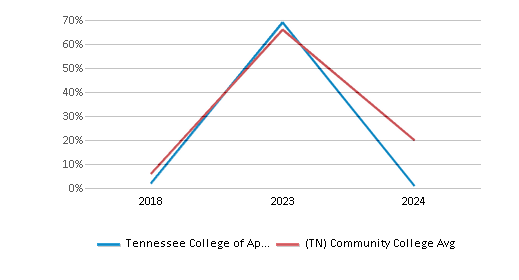
69%
9%
This chart displays the percentage of Hawaiian students in Tennessee College of Applied Technology-Hartsville and the percentage of Hawaiian community college students in Tennessee by year, with the latest 2023-24 school year data.
% Two or more races
20%
3%
% Non Resident races
n/a
1%
% Unknown races
n/a
3%
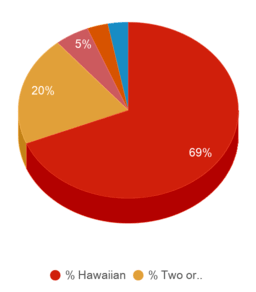
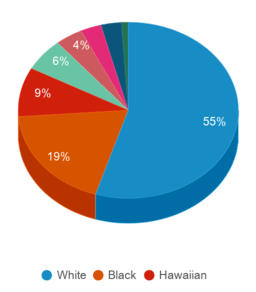
This chart displays the percentage breakdown of students of all ethnic groups in Tennessee College of Applied Technology-Hartsville.
This chart displays the percentage breakdown of students of all ethnic groups in Tennessee.
Diversity Score
0.48
0.65
This chart displays the diversity score of Tennessee College of Applied Technology-Hartsville and the community college average diversity score of Tennessee by year, with the latest 2022-23 school year data.
College Completion Rate (Students who graduate in less than 4 years)
0.5156%
0.6038%
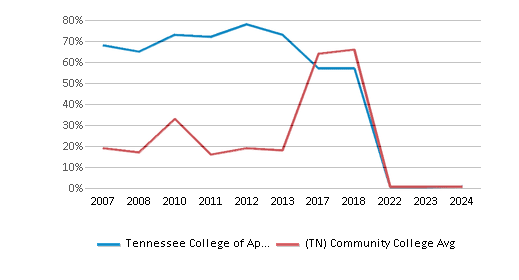
This chart displays completion rates for First-Time of Full-time students of Tennessee College of Applied Technology-Hartsville and community college average completion rates for First-Time of Full-time students of Tennessee by year, with the latest 2023-24 school year data.
College Completion Rate (Students who graduate in 4 years or more than 4 years)
n/a
0.5213%
Average Graduate Earnings (10 Years)
$31,500
$29,000
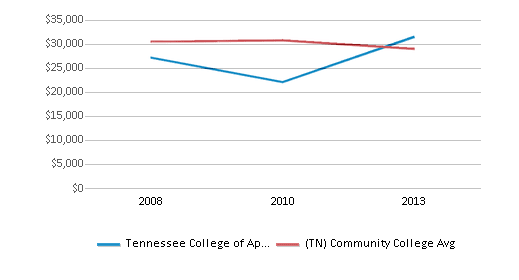
This chart displays average graduate earnings (10 Years) of Tennessee College of Applied Technology-Hartsville and community college average graduate earnings (10 Years) of Tennessee by year, disaggregated by student subgroups with the latest 2012-13 school year data.

Tuition and Acceptance Rate

% Students Receiving Some Financial Aid
100%
97%
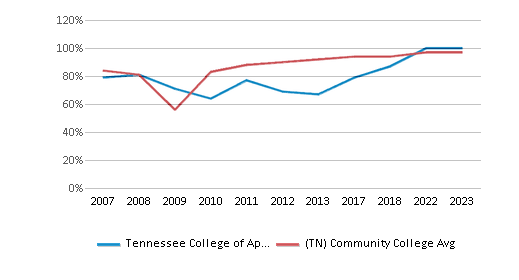
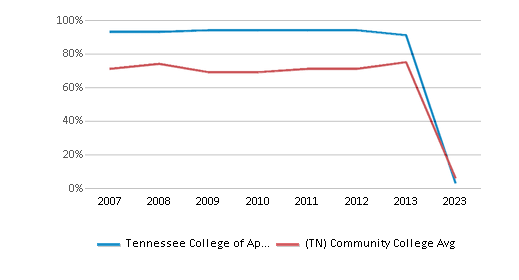
This chart displays the percent of students who is receiving some financial aid in Tennessee College of Applied Technology-Hartsville and the percent of community college students who is receiving some financial aid in Tennessee by year, with the latest 2022-23 school year data.
Median Debt for Graduates
n/a
$11,730
Median Debt for Dropouts
n/a
$5,250
Acceptance Rate
n/a
83%
SAT Reading
n/a
415
SAT Math
n/a
455
SAT Writing
n/a
469
ACT Composite
n/a
20
ACT English
n/a
19
ACT Math
n/a
19
Source: 2024 (or latest year available) Integrated Postsecondary Education Data System (IPEDS)
Profile last updated: 08/14/2024

Frequently Asked Questions

What is Tennessee College of Applied Technology-Hartsville's ranking?
Tennessee College of Applied Technology-Hartsville ranks among the top 20% of community college in Tennessee for: Average community college minority breakdown and Percent of students receiving financial aid.

Recent Articles

Careers: Broadcasting
Take advantage of career opportunities in the field of radio broadcasting by starting your training at your local community college.
Unlocking Airport Career Opportunities: Your Guide to Ground Jobs
Discover the diverse range of ground jobs at mid-size U.S. airports, their educational requirements, and how community colleges can prepare you for these exciting careers.
Adult Learners: Upgrading Your Skills
We offer straightforward advice on identifying transferable skills, exploring job opportunities, leveraging community resources, and embracing lifelong learning. With relatable examples and encouragement, this guide aims to empower readers to navigate the job market confidently and successfully transition into new careers.

Quick Stats (2025)

  • Enrollment: 696 students
  • Minority enrollment: 97%
  • Source: Integrated Postsecondary Education Data System (IPEDS)

Did You Know?

For Tennessee public community colleges, the average tuition is approximately $5,176 per year for in-state students and $15,746 for out-of-state students. For private community colleges, the average yearly tuition is approximately $13,551 per year. Read more about average community college tuition costs across the country.

The average community college acceptance rate in Tennessee is 79%. Read more about national community college acceptance rates.

Tennessee community colleges have a diversity score of 0.65, which is higher than the national average of 0.00. The most diverse community college in Tennessee is Hussian College-Daymar College Murfreesboro. Read more about community college diversity statistics in the USA.

Quick Links