- The Sterling College community combines structured academic study with experiential challenges and plain hard work to build responsible problems solvers who become stewards of the environment as they pursue productive lives.
School Highlights
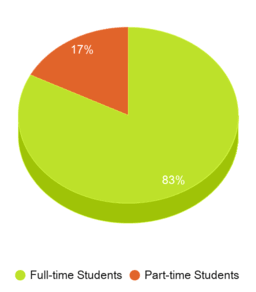
Sterling College serves 115 students (83% of students are full-time).
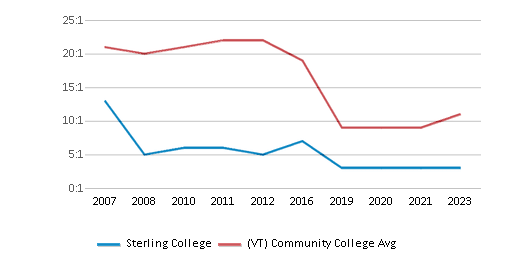
The college's student:teacher ratio of 3:1 is lower than the state community college average of 16:1.
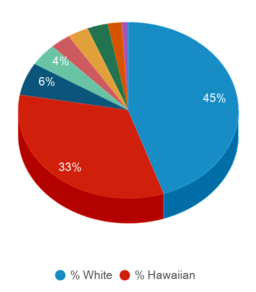
Minority enrollment is 55% of the student body (majority Hispanic and Asian), which is more than the state average of 22%.
Quick Stats (2025)
- Enrollment: 115 students
- Private-state tuition: $33,492
- Acceptance Rate: 100%
- Student:teacher ratio: 3:1
- Minority enrollment: 55%
- Source: Integrated Postsecondary Education Data System (IPEDS)
Top Rankings
Sterling College ranks among the top 20% of public schools in Vermont for:
Category
Attribute
Diversity
School Resources
School Overview
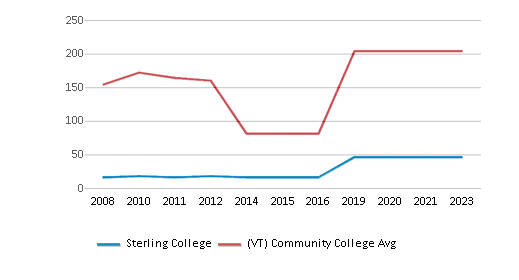
The teacher population of 46 teachers has stayed relatively flat over five years.
Sterling College
(VT) Community College Avg.
Carnegie Classification
Baccalaureate Colleges: Diverse Fields
Baccalaureate/Associate's Colleges: Mixed Baccalaureate/Associate's
Institution Level
Four or more years
Four or more years
Institution Control
Private not-for-profit
Private not-for-profit
Total Faculty
46 staff
204 staff
School Calendar
Student Body
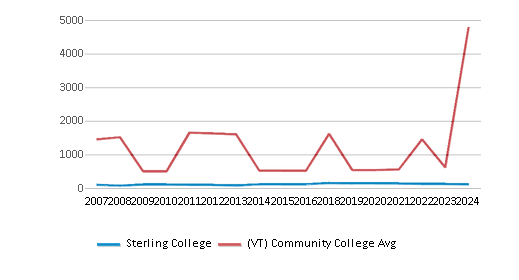
The student population of Sterling College has declined by 21% over five years.
The student:teacher ratio of 3:1 has stayed the same over five years.
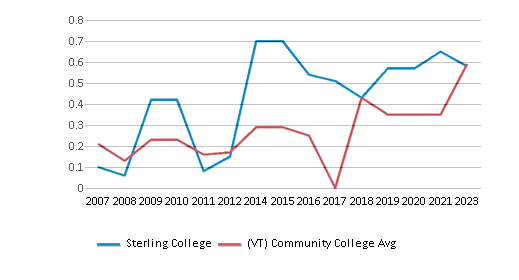
The Sterling College diversity score of 0.68 is more than the state average of 0.38. The school's diversity has grown by 19% over five years.
Total Enrollment
115 students
1,071 students
Student : Teacher Ratio
3:1
16:1
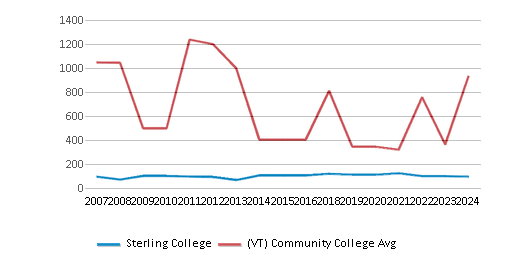
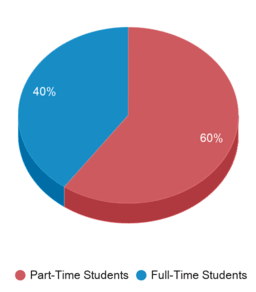
# Full-Time Students
95 students
430 students
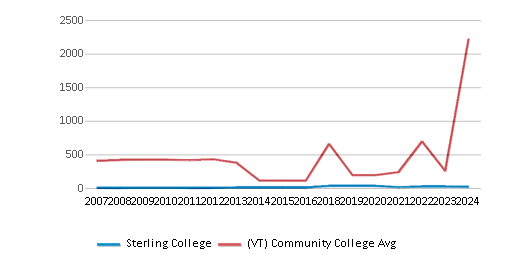
# Part-Time Students
20 students
641 students
# Enrollment Undergraduate
115 students
393 students
# Full-Time Undergraduate Students
95 students
430 students
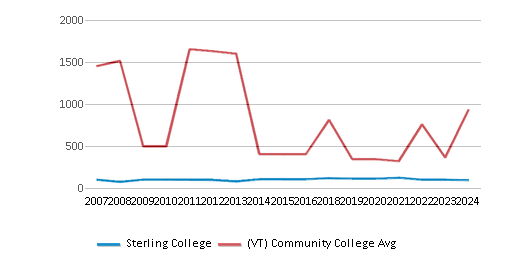
# Full-Time Graduate Students
n/a
33 students
# Part-Time Undergraduate Students
20 students
512 students
# Part-Time Graduate Students
n/a
810 students
Total Dormitory Capacity
118 students
118 students
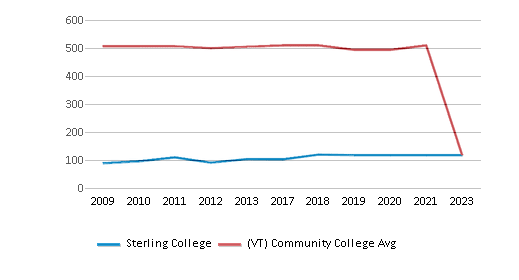
% American Indian/Alaskan
1%
n/a
% Asian
3%
2%
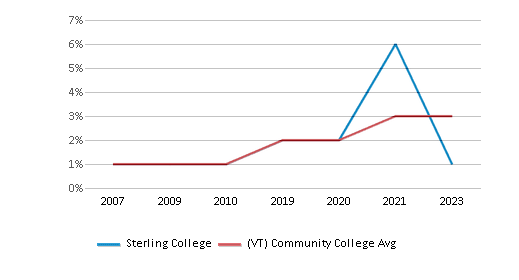
% Hispanic
4%
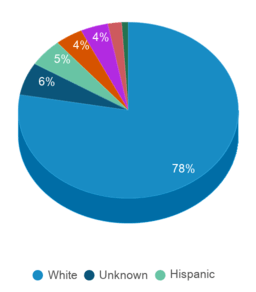
5%
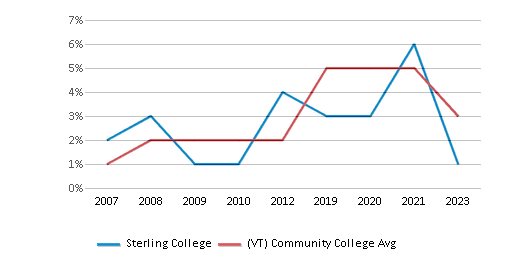
% Black
2%
4%
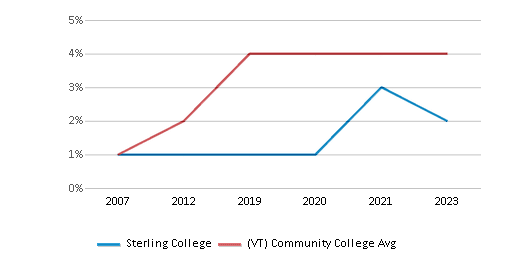
% White
45%
78%
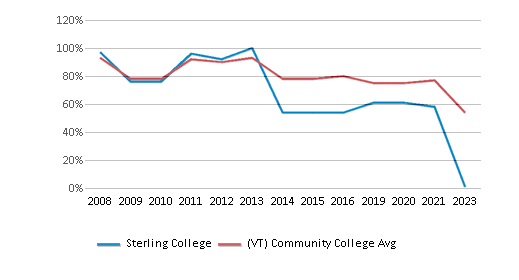
% Hawaiian
33%
n/a
% Two or more races
3%
4%
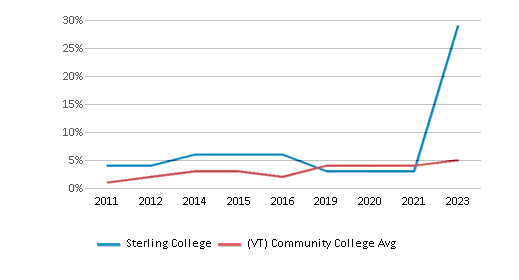
% Non Resident races
3%
1%
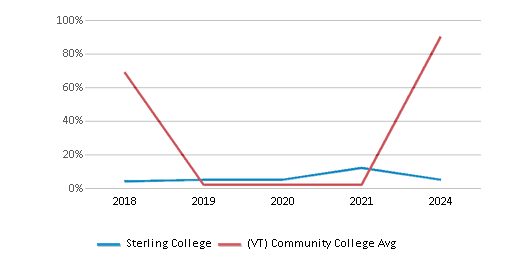
% Unknown races
6%
6%
Diversity Score
0.68
0.38
College Completion Rate (Students who graduate in less than 4 years)
n/a
24%
College Completion Rate (Students who graduate in 4 years or more than 4 years)
0.2963%
0.3404%
Average Graduate Earnings (10 Years) (Year 2008)
$26,500
$33,600
Tuition and Acceptance Rate
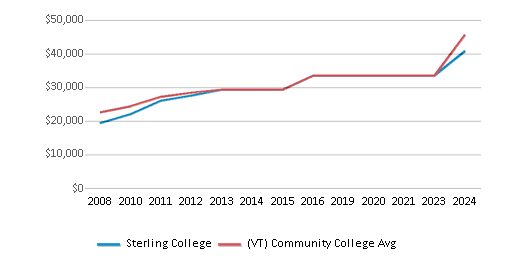
The private state tuition of $33,492 is less than the state average of $38,857. The private state tuition has declined by 14% over four years.
Private State Tuition Fees
$33,492
$38,857
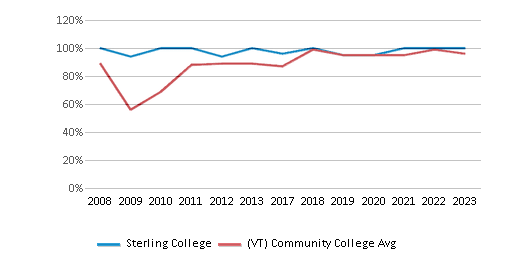
% Students Receiving Some Financial Aid
100%
96%
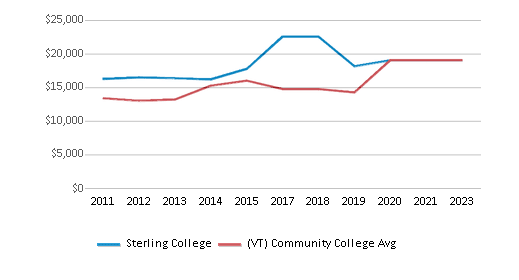
Median Debt for Graduates
$19,042
$19,042
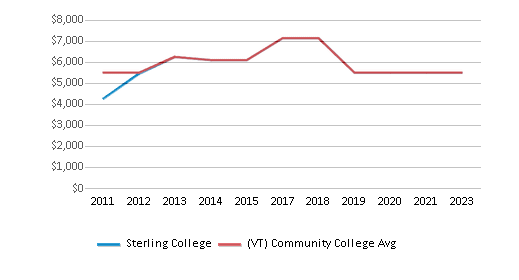
Median Debt for Dropouts
$5,500
$5,500
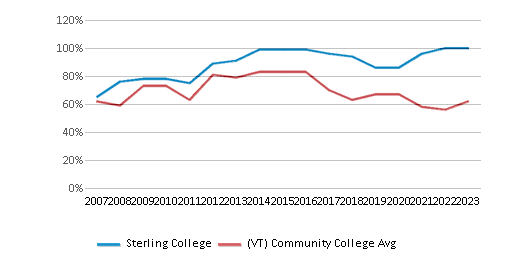
Acceptance Rate
100%
62%
SAT Reading
n/a
455
SAT Math
n/a
485
SAT Writing
n/a
435
ACT Composite
n/a
21
ACT English
n/a
19
ACT Math
n/a
21
Source: 2024 (or latest year available) Integrated Postsecondary Education Data System (IPEDS)
School Notes
- Sterling was founded by Norman Rioux in 1958 as a boys' college preparatory school. It was named after Margaret Sterling, the deceased wife of Douglas Field. Mr. Field was one of several Berkshire School (MA) faculty members who came here with Mr. Rioux. When the alternative preparatory school market waned in the early 1970s, Sterling was well positioned to respond creatively. First came the Academic Short Course in Outdoor Leadership, a 21-day program for 13 to 16 year olds. It brought hundreds of young people to Sterling for an intense winter learning experience. The Short Course solidified women's presence on campus to share equally in the benefits of a Sterling education. An extension of this idea became the year-long Grassroots project, an immediate success that led Sterling into the world of higher education. Sterling's first Associate of Arts Degree in Resource Management was awarded in 1982. Full accreditation by the New England Association of Schools and Colleges was granted in 1987. Several members of the Grassroots Faculty continue to teach at the College today. Facilities on the hundred-plus acre Sterling College campus include fourteen residential, administrative, and classroom buildings, a woodworking shop, and library. Outdoor teaching facilities include a managed woodlot, a challenge course, a 30-foot climbing tower, organic gardens, and a working livestock farm with two solar/wind powered barns. Much of what is grown and raised is consumed in the dining hall. The Center for Northern Studies at Sterling College includes a 300-acre boreal wetland and a building containing a library, science lab, seminar rooms, offices, and central lounge. Sterling College offers bachelor's degrees in Conservation Ecology, Outdoor Education and Leadership, Northern Studies, Self-Designed Studies and Sustainable Agriculture.
Frequently Asked Questions
How much does Sterling College cost?
Sterling College's private state tuition is approximately $33,492.
What is the acceptance rate of Sterling College?
The acceptance rate of Sterling College is 100%, which is higher than the state average of 62%.
What is Sterling College's ranking?
Sterling College ranks among the top 20% of community college in Vermont for: Diversity in US community colleges, Average community college minority breakdown and Percent of students receiving financial aid.
Recent Articles

Obtaining Your Bachelor's Degree at a Community College
Explore the evolving landscape of community colleges offering bachelor's degrees, addressing affordability, accessibility, and workforce needs.

A to Z of Community College Certificates and Courses
From business and healthcare to technology and skilled trades, the article showcases the breadth of options available to students seeking to enhance their knowledge, develop new skills, or pursue career advancement.

What is a Community College?
This comprehensive guide explains what a community college is, its history, and its role in higher education. It covers the types of programs offered, differences from four-year colleges, benefits of attending, and important considerations for prospective students, providing valuable insights for those exploring educational options.

