Stanbridge University

2041 Business Ctr Dr Ste 107
Irvine, CA 92612
Top Ranked (2024-25): View Rankings

School Highlights

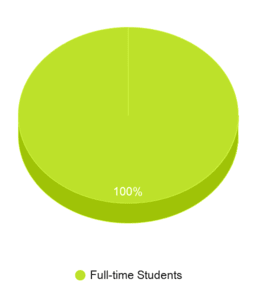
Stanbridge University serves 3,124 students (100% of students are full-time).
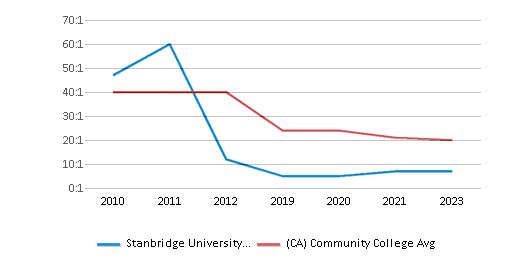
The college's student:teacher ratio of 12:1 is lower than the state community college average of 32:1.
Minority enrollment is 87% of the student body (majority Hispanic), which is more than the state average of 77%.

Quick Stats (2024-25)

  • Enrollment: 3,124 students
  • Acceptance Rate: 10%
  • Student:teacher ratio: 12:1
  • Minority enrollment: 87%
  • Source: Verified school update

Top Rankings

Stanbridge University ranks among the top 20% of public schools in California for:

School Overview

The teacher population of 256 teachers has stayed relatively flat over five years.
Stanbridge University
(CA) Community College Avg.
Carnegie Classification
Special Focus Four-Year: Other Health Professions Schools
Baccalaureate/Associate's Colleges: Associate's Dominant
Institution Level
Four or more years
At least 2 but less than 4 years
Institution Control
Private for-profit
Public
Total Faculty
256 staff
294 staff
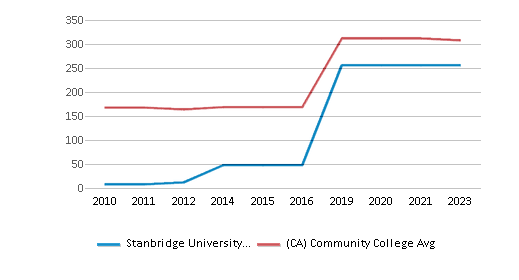
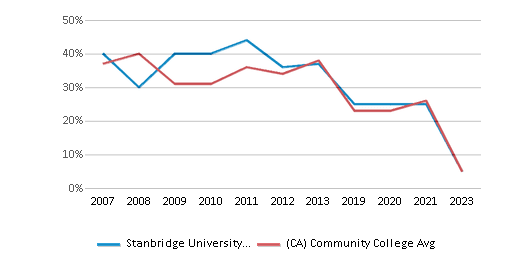
This chart displays total faculty of Stanbridge University and community college average number of faculty in California by year, with the latest 2022-23 school year data.
Number of Programs Offered
7
12

Student Body

The student population of Stanbridge University has grown by 129% over five years.
The student:teacher ratio of 12:1 has increased from 5:1 over five years.
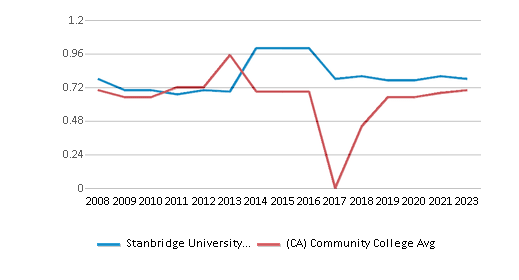
The Stanbridge University diversity score of 0.78 is more than the state average of 0.70. The school's diversity has stayed relatively flat over five years.
Total Enrollment
3,124 students
2,311 students
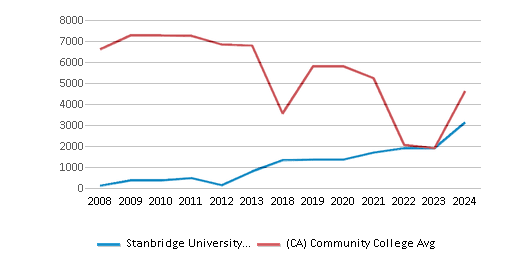
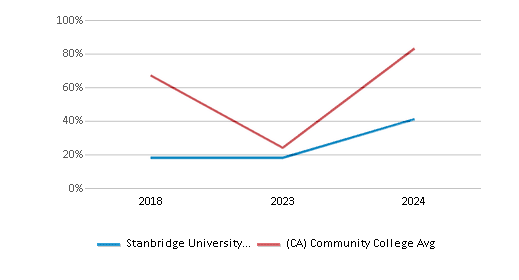
This chart displays the total enrollment of Stanbridge University and community college average number of enrollment of California by year, with the latest 2023-24 school year data.
Student : Teacher Ratio
12:1
32:1
This chart displays the student staff ratio of Stanbridge University and community college average student staff ratio of California by year, with the latest 2022-23 school year data.
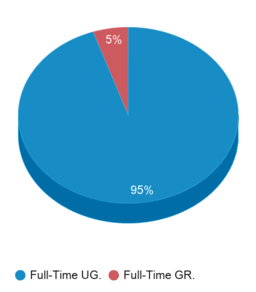
# Full-Time Students
3,124 students
1,232 students
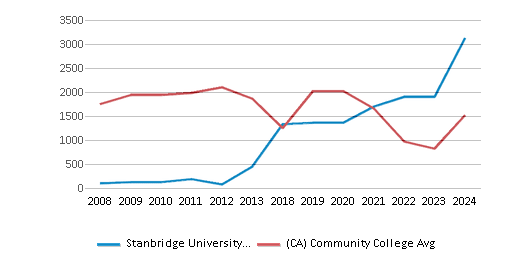
This chart displays the total number of Full-time students enrollment of Stanbridge University and average number of community college Full-time students enrollment of California by year, with the latest 2023-24 school year data.
# Part-Time Students
n/a
8,299 students
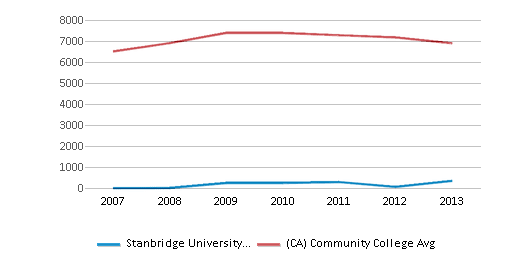
This chart displays the total number of Part-time students enrollment of Stanbridge University and average number of community college Part-time students enrollment of California by year, with the latest 2012-13 school year data.
This chart displays the Full-time students and Part-time students enrollment breakdown of Stanbridge University.
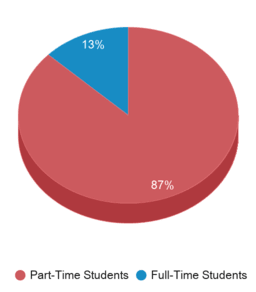
This chart displays community college average Full-Time students and Part-Time students enrollment breakdown of California.
# Enrollment Undergraduate
284 students
240 students
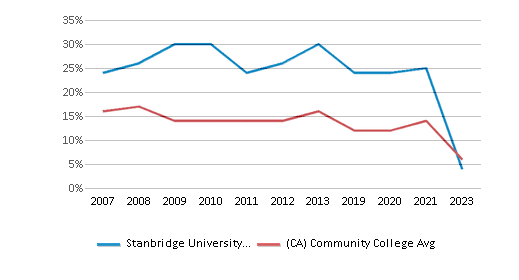
# Full-Time Undergraduate Students
2,845 students
1,155 students
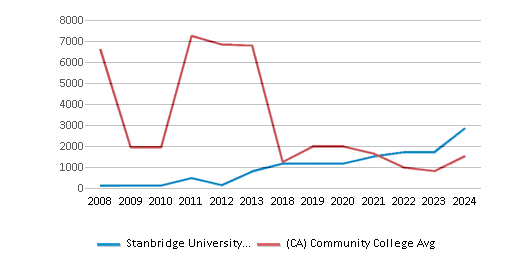
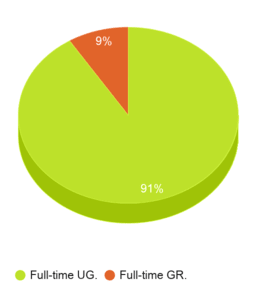
This chart displays the total number of Full-time undergraduate students enrollment of Stanbridge University and average number of community college Full-time undergraduate  students enrollment of California by year, with the latest 2023-24 school year data.
# Full-Time Graduate Students
279 students
63 students
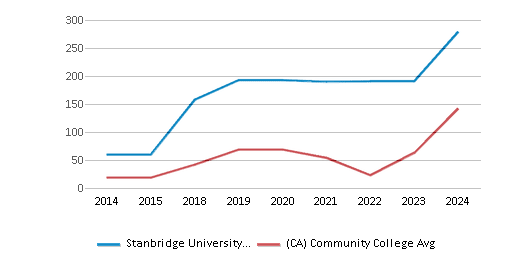
This chart displays the total number of Full-time graduate students enrollment of Stanbridge University and average number of community college Full-time graduate students enrollment of California by year, with the latest 2023-24 school year data.
This chart displays graduation rate breakdown of Stanbridge University
California All Graduation Breakdown
# Part-Time Undergraduate Students
n/a
8,457 students
# Part-Time Graduate Students
n/a
10 students
Total Dormitory Capacity
n/a
140 students
% American Indian/Alaskan
n/a
n/a
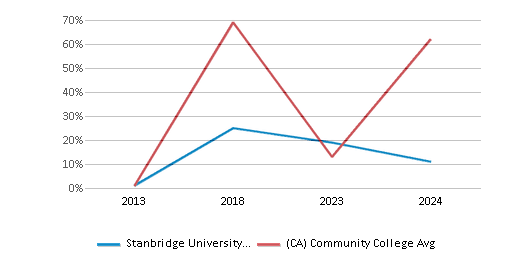
This chart displays the percentage of American Indian/Alaskan students in Stanbridge University and the percentage of American Indian/Alaskan community college students in California by year, with the latest 2023-24 school year data.
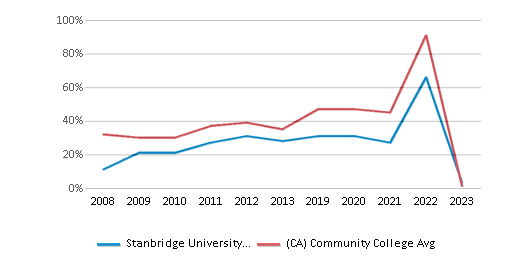
% Asian
21%
13%
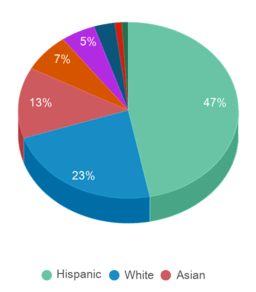
This chart displays the percentage of Asian students in Stanbridge University and the percentage of Asian community college students in California by year, with the latest 2022-23 school year data.
% Hispanic
39%
47%
This chart displays the percentage of Hispanic students in Stanbridge University and the percentage of Hispanic community college students in California by year, with the latest 2022-23 school year data.
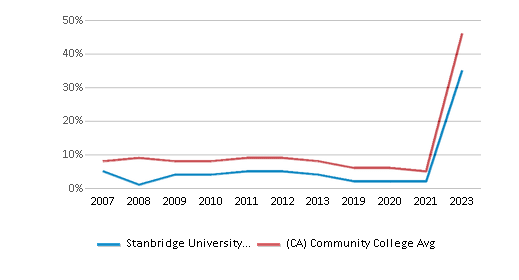
% Black
4%
7%
This chart displays the percentage of Black students in Stanbridge University and the percentage of Black community college students in California by year, with the latest 2022-23 school year data.
% White
13%
23%
This chart displays the percentage of White students in Stanbridge University and the percentage of White community college students in California by year, with the latest 2022-23 school year data.
% Hawaiian
1%
1%
This chart displays the percentage of Hawaiian students in Stanbridge University and the percentage of Hawaiian community college students in California by year, with the latest 2023-24 school year data.
% Two or more races
4%
5%
This chart displays the percentage of Two or more races students in Stanbridge University and the percentage of Two or more races community college students in California by year, with the latest 2022-23 school year data.
% Non Resident races
n/a
1%
% Unknown races
17%
3%
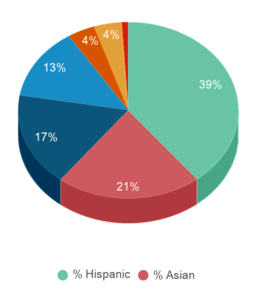
This chart displays the percentage breakdown of students of all ethnic groups in Stanbridge University.
This chart displays the percentage breakdown of students of all ethnic groups in California.
Diversity Score
0.78
0.70
This chart displays the diversity score of Stanbridge University and the community college average diversity score of California by year, with the latest 2022-23 school year data.
College Completion Rate (Students who graduate in less than 4 years) (Year 2010)
77%
29%
College Completion Rate (Students who graduate in 4 years or more than 4 years)
0.621%
0.4304%

Tuition and Acceptance Rate

% Students Receiving Some Financial Aid
84%
85%
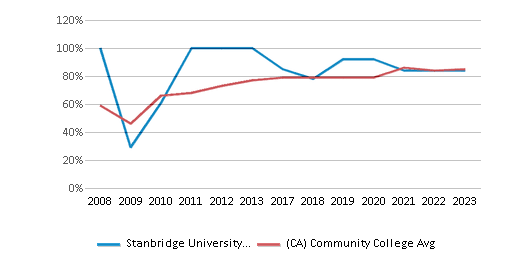
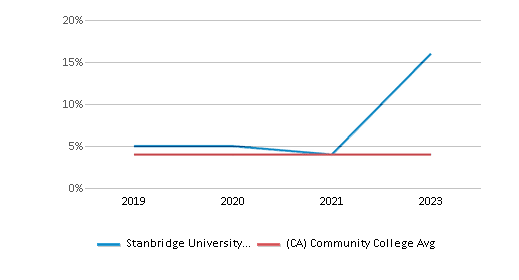
This chart displays the percent of students who is receiving some financial aid in Stanbridge University and the percent of community college students who is receiving some financial aid in California by year, with the latest 2022-23 school year data.
Median Debt for Graduates
$20,002
$10,500
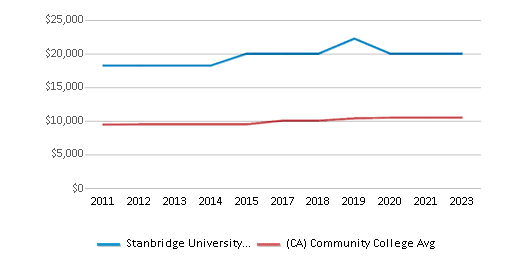
This chart displays median debt for students who have completed a certificate or degree in Stanbridge University and average median debt for community college students who have completed a certificate or degree in California by year, with the latest 2022-23 school year data.
Median Debt for Dropouts
$4,750
$6,239
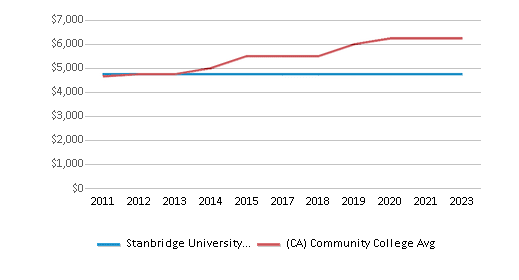
This chart displays median debt for students who have not completed a certificate or degree in Stanbridge University and average median debt for community college students who have not completed a certificate or degree in California by year, with the latest 2022-23 school year data.
Acceptance Rate
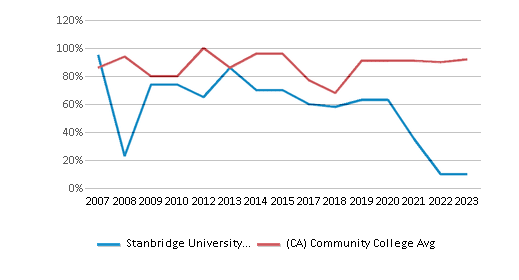
10%
92%
This chart displays the percent admitted of Stanbridge University and the community college average percent admitted of California by year, with the latest 2022-23 school year data.
Source: 2024 (or latest year available) Integrated Postsecondary Education Data System (IPEDS) , School Administrators

Frequently Asked Questions

What schools are Stanbridge University often compared to?
Stanbridge Universityis often viewed alongside schools like Irvine Valley College by visitors of our site.
What is the acceptance rate of Stanbridge University?
The acceptance rate of Stanbridge University is 10%, which is lower than the state average of 92%. Stanbridge University's acceptance rate is ranked among the top community colleges in California with low acceptance rates.
What is Stanbridge University's ranking?
Stanbridge University ranks among the top 20% of community college in California for: Lowest acceptance rates and Diversity in US community colleges.
In what neighborhood is Stanbridge University located?
Stanbridge University is located in the Irvine Business Complex neighborhood of Irvine, CA. There are 1 other community '.college.' located in Irvine Business Complex.

Recent Articles

Is President Obama's Plan for Free Community College Right for America?
President Obama recently introduced a plan to deliver free Community College tuition to all Americans across the country. Is it the right call?In this story, we will not attempt to make a judgment call on whether free Community College is right or wrong for the United States. Instead, we paneled a few experts in education and economics to get their take on the issue. We’re showing both sides of the coin, and letting readers decide on their own.
Adult Learners: Upgrading Your Skills
We offer straightforward advice on identifying transferable skills, exploring job opportunities, leveraging community resources, and embracing lifelong learning. With relatable examples and encouragement, this guide aims to empower readers to navigate the job market confidently and successfully transition into new careers.
Should You Declare Academic Bankruptcy?
Learn about academic bankruptcy, its benefits and disadvantages, and whether this option is right for your GPA and financial aid eligibility.

Quick Stats (2024-25)

  • Enrollment: 3,124 students
  • Acceptance Rate: 10%
  • Student:teacher ratio: 12:1
  • Minority enrollment: 87%
  • Source: Verified school update

Related School Videos

Did You Know?

Orange County, CA community colleges have a diversity score of 0.74, which is higher than the national average of 0.00. The most diverse community college in Orange County, CA is FIDM-Fashion Institute of Design & Merchandising-Orange County. Read more about community college diversity statistics in the USA.

Quick Links