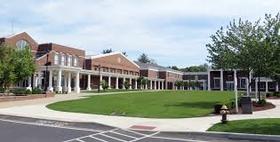
San Joaquin Valley College-Hanford Classroom

215 West 7th Street
Hanford, CA 93230
Top Ranked (2024-25): View Rankings
  • In 1980, SBBCollege opened a campus in Santa Maria to better serve students in northern Santa Barbara County and San Luis Obispo County. The Santa Maria college campus quickly became a local college favorite along the central coast. The campus offers computer and medical labs and a learning resource center. Our technical college in Santa Maria serves the communities of santa maria, lompoc, arroyo grande, grover beach, nipomo, oceano, pismo beach, solvang, santa ynez, buellton, casmalia, guadalupe, los alamos, los olivos, new cuyama, san luis obispo, santa margarita, paso robles, morro bay, los osos, creston, bradley, atascadero, and other nearby areas. At Santa Barbara Business College, helping students prepare for new careers begins with an initial interview. By taking the time to personally meet with you, our representatives can help you discover a clear path for your field of study. Our staff is trained to listen to each student's personal interests and goals. After evaluating your needs, we will review the curriculum that is most appropriate for you, to provide the best opportunities for success in today's job market.

School Highlights

San Joaquin Valley College-Hanford Classroom serves 75 students (100% of students are full-time).
The college's student:teacher ratio of 7:1 is lower than the state community college average of 20:1.
Minority enrollment is 99% of the student body (majority Black), which is more than the state average of 95%.

Quick Stats (2024-25)

  • Enrollment: 75 students
  • Private-state tuition: $15,226
  • Acceptance Rate: 49%
  • Student:teacher ratio: 7:1
  • Minority enrollment: 99%
  • Source: Integrated Postsecondary Education Data System (IPEDS)

Top Rankings

San Joaquin Valley College-Hanford Classroom ranks among the top 20% of public schools in California for:

School Overview

The teacher population of 11 teachers has stayed relatively flat over five years.
San Joaquin Valley College-Hanford Classroom
(CA) Community College Avg.
Carnegie Classification
Not applicable, not in Carnegie universe (not accredited or nondegree-granting)
Associates--Public Special Use
Institution Level
Less than 2 years (below associate)
At least 2 but less than 4 years
Institution Control
Private for-profit
Public
Total Faculty
11 staff
294 staff
This chart displays total faculty of San Joaquin Valley College-Hanford Classroom and community college average number of faculty in California by year, with the latest 2022-23 school year data.

Student Body

The student population of San Joaquin Valley College-Hanford Classroom has declined by 15% over five years.
The student:teacher ratio of 7:1 has decreased from 8:1 over five years.
The San Joaquin Valley College-Hanford Classroom diversity score of 0.60 is less than the state average of 0.71. The school's diversity has grown by 10% over five years.
Total Enrollment
75 students
5,744 students
This chart displays the total enrollment of San Joaquin Valley College-Hanford Classroom and community college average number of enrollment of California by year, with the latest 2022-23 school year data.
Student : Teacher Ratio
7:1
20:1
This chart displays the student staff ratio of San Joaquin Valley College-Hanford Classroom and community college average student staff ratio of California by year, with the latest 2022-23 school year data.
# Full-Time Students
75 students
813 students
This chart displays the total number of Full-time students enrollment of San Joaquin Valley College-Hanford Classroom and average number of community college Full-time students enrollment of California by year, with the latest 2022-23 school year data.
# Part-Time Students
n/a
4,931 students
This chart displays the Full-time students and Part-time students enrollment breakdown of San Joaquin Valley College-Hanford Classroom.
This chart displays community college average Full-Time students and Part-Time students enrollment breakdown of California.
# Enrollment Undergraduate
100 students
302 students
# Full-Time Undergraduate Students
75 students
813 students
This chart displays the total number of Full-time undergraduate students enrollment of San Joaquin Valley College-Hanford Classroom and average number of community college Full-time undergraduate  students enrollment of California by year, with the latest 2022-23 school year data.
# Full-Time Graduate Students
n/a
63 students
# Part-Time Undergraduate Students
n/a
4,962 students
# Part-Time Graduate Students
n/a
10 students
Total Dormitory Capacity
n/a
140 students
% American Indian/Alaskan
2%
13%
This chart displays the percentage of American Indian/Alaskan students in San Joaquin Valley College-Hanford Classroom and the percentage of American Indian/Alaskan community college students in California by year, with the latest 2022-23 school year data.
% Asian
3%
6%
This chart displays the percentage of Asian students in San Joaquin Valley College-Hanford Classroom and the percentage of Asian community college students in California by year, with the latest 2022-23 school year data.
% Hispanic
26%
1%
This chart displays the percentage of Hispanic students in San Joaquin Valley College-Hanford Classroom and the percentage of Hispanic community college students in California by year, with the latest 2022-23 school year data.
% Black
57%
46%
This chart displays the percentage of Black students in San Joaquin Valley College-Hanford Classroom and the percentage of Black community college students in California by year, with the latest 2022-23 school year data.
% White
1%
5%
This chart displays the percentage of White students in San Joaquin Valley College-Hanford Classroom and the percentage of White community college students in California by year, with the latest 2022-23 school year data.
% Hawaiian
8%
24%
This chart displays the percentage of Hawaiian students in San Joaquin Valley College-Hanford Classroom and the percentage of Hawaiian community college students in California by year, with the latest 2022-23 school year data.
% Two or more races
1%
4%
This chart displays the percentage of Two or more races students in San Joaquin Valley College-Hanford Classroom and the percentage of Two or more races community college students in California by year, with the latest 2022-23 school year data.
% Unknown races
2%
1%
This chart displays the percentage breakdown of students of all ethnic groups in San Joaquin Valley College-Hanford Classroom.
This chart displays the percentage breakdown of students of all ethnic groups in California.
Diversity Score
0.60
0.71
This chart displays the diversity score of San Joaquin Valley College-Hanford Classroom and the community college average diversity score of California by year, with the latest 2022-23 school year data.
College Completion Rate (Students who graduate in less than 4 years)
0.6806%
0.4179%
This chart displays completion rates for First-Time of Full-time students of San Joaquin Valley College-Hanford Classroom and community college average completion rates for First-Time of Full-time students of California by year, with the latest 2022-23 school year data.
College Completion Rate (Students who graduate in 4 years or more than 4 years)
0.14%
0.4884%
Average Graduate Earnings (10 Years)
$27,600
$34,700
This chart displays average graduate earnings (10 Years) of San Joaquin Valley College-Hanford Classroom and community college average graduate earnings (10 Years) of California by year, disaggregated by student subgroups with the latest 2012-13 school year data.

Tuition and Acceptance Rate

The private state tuition of $15,226 is less than the state average of $20,392. The private state tuition has grown by 52% over four years.
Private State Tuition Fees
$15,226
$20,392
This chart displays tuition fees for an in-state student of San Joaquin Valley College-Hanford Classroom and the private community college average tuition fees for an in-state student of California by year, with the latest 2022-23 school year data.
% Students Receiving Some Financial Aid
100%
85%
This chart displays the percent of students who is receiving some financial aid in San Joaquin Valley College-Hanford Classroom and the percent of community college students who is receiving some financial aid in California by year, with the latest 2022-23 school year data.
Median Debt for Graduates
$8,770
$10,500
This chart displays median debt for students who have completed a certificate or degree in San Joaquin Valley College-Hanford Classroom and average median debt for community college students who have completed a certificate or degree in California by year, with the latest 2022-23 school year data.
Median Debt for Dropouts
$3,314
$6,239
This chart displays median debt for students who have not completed a certificate or degree in San Joaquin Valley College-Hanford Classroom and average median debt for community college students who have not completed a certificate or degree in California by year, with the latest 2022-23 school year data.
Acceptance Rate
49%
80%
This chart displays the percent admitted of San Joaquin Valley College-Hanford Classroom and the community college average percent admitted of California by year, with the latest 2009-10 school year data.
Source: 2023 (or latest year available) Integrated Postsecondary Education Data System (IPEDS)

Frequently Asked Questions

How much does San Joaquin Valley College-Hanford Classroom cost?
San Joaquin Valley College-Hanford Classroom's private state tuition is approximately $15,226.
What schools are San Joaquin Valley College-Hanford Classroom often compared to?
San Joaquin Valley College-Hanford Classroomis often viewed alongside schools like Allan Hancock College by visitors of our site.
What is the acceptance rate of San Joaquin Valley College-Hanford Classroom?
The acceptance rate of San Joaquin Valley College-Hanford Classroom is 49%, which is lower than the state average of 80%.
What is San Joaquin Valley College-Hanford Classroom's ranking?
San Joaquin Valley College-Hanford Classroom ranks among the top 20% of community college in California for: Average community college minority breakdown and Percent of students receiving financial aid.

Recent Articles

What is a Community College?
This comprehensive guide explains what a community college is, its history, and its role in higher education. It covers the types of programs offered, differences from four-year colleges, benefits of attending, and important considerations for prospective students, providing valuable insights for those exploring educational options.
Value of an Associates vs. Bachelors Degree
This comprehensive guide compares the value of associate's and bachelor's degrees, exploring factors such as program length, cost, earning potential, and career opportunities. It provides valuable insights for students deciding between these two educational paths, emphasizing the importance of aligning degree choice with personal and professional goals.
How to Earn Your GED and College Degree Simultaneously
This comprehensive guide explores how students can earn their GED and college degree simultaneously through community college programs. It discusses the economic benefits, admission requirements, and steps to enroll in such programs, providing valuable information for those seeking to advance their education and career prospects.

Quick Stats (2024-25)

  • Enrollment: 75 students
  • Private-state tuition: $15,226
  • Acceptance Rate: 49%
  • Student:teacher ratio: 7:1
  • Minority enrollment: 99%
  • Source: Integrated Postsecondary Education Data System (IPEDS)

Did You Know?

For California public community colleges, the average tuition is approximately $1,236 per year for in-state students and $6,547 for out-of-state students. For private community colleges, the average yearly tuition is approximately $20,392 per year. Read more about average community college tuition costs across the country.

The average community college acceptance rate in California is 81%. Read more about national community college acceptance rates.

California community colleges have a diversity score of 0.71, which is lower than the national average of 0.75. The most diverse community college in California is International Academy of Design and Technology-Sacramento. Read more about community college diversity statistics in the USA.

Quick Links