Rasmussen University-Illinois

6000 East State Street, 4th Floor
Rockford, IL 61108
Top Ranked (2025): View Rankings

School Highlights

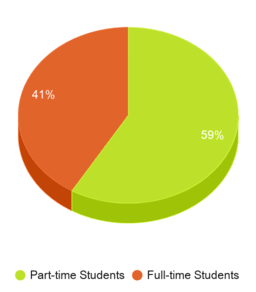
Rasmussen University-Illinois serves 3,643 students (41% of students are full-time).
The college's student:teacher ratio of 17:1 is lower than the state community college average of 21:1.
Minority enrollment is 81% of the student body (majority Black), which is more than the state average of 53%.

Quick Stats (2025)

  • Enrollment: 3,643 students
  • Private-state tuition: $10,764
  • Acceptance Rate: 83%
  • Student:teacher ratio: 17:1
  • Minority enrollment: 81%
  • Source: Integrated Postsecondary Education Data System (IPEDS)

Top Rankings

Rasmussen University-Illinois ranks among the top 20% of public schools in Illinois for:

School Overview

The teacher population of 212 teachers has stayed relatively flat over five years.
Rasmussen University-Illinois
(IL) Community College Avg.
Carnegie Classification
Baccalaureate/Associate's Colleges: Associate's Dominant
Associate's Colleges: Mixed Transfer/Career & Technical-High Nontraditional
Institution Level
At least 2 but less than 4 years
Institution Control
Private for-profit
Public
Total Faculty
212 staff
227 staff
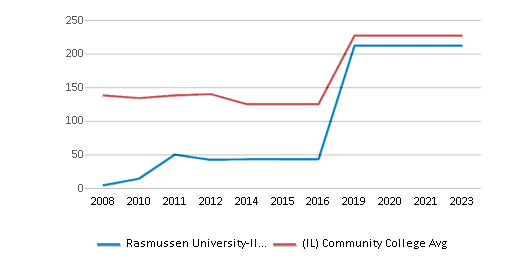
This chart displays total faculty of Rasmussen University-Illinois and community college average number of faculty in Illinois by year, with the latest 2022-23 school year data.

Student Body

The student population of Rasmussen University-Illinois has grown by 71% over five years.
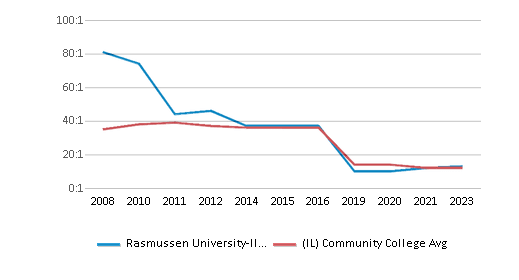
The student:teacher ratio of 17:1 has increased from 12:1 over five years.
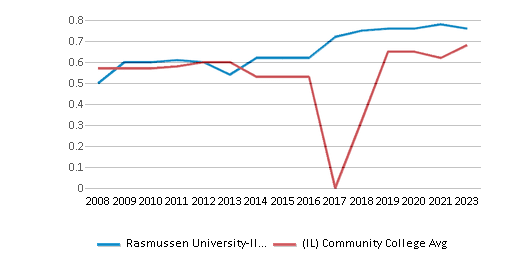
The Rasmussen University-Illinois diversity score of 0.73 is more than the state average of 0.69. The school's diversity has stayed relatively flat over five years.
Total Enrollment
3,643 students
3,270 students
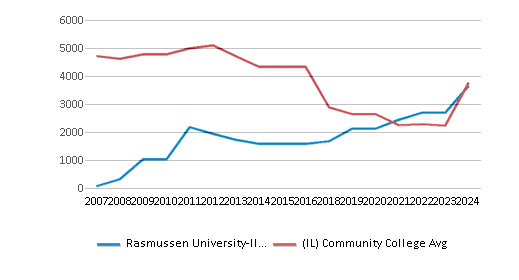
This chart displays the total enrollment of Rasmussen University-Illinois and community college average number of enrollment of Illinois by year, with the latest 2023-24 school year data.
Student : Teacher Ratio
17:1
21:1
This chart displays the student staff ratio of Rasmussen University-Illinois and community college average student staff ratio of Illinois by year, with the latest 2022-23 school year data.
# Full-Time Students
1,508 students
1,007 students
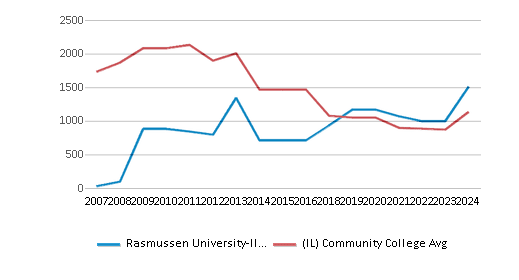
This chart displays the total number of Full-time students enrollment of Rasmussen University-Illinois and average number of community college Full-time students enrollment of Illinois by year, with the latest 2023-24 school year data.
# Part-Time Students
2,135 students
2,747 students
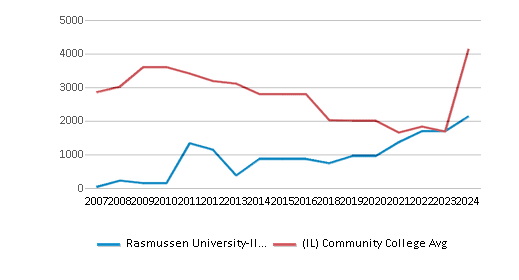
This chart displays the total number of Part-time students enrollment of Rasmussen University-Illinois and average number of community college Part-time students enrollment of Illinois by year, with the latest 2023-24 school year data.
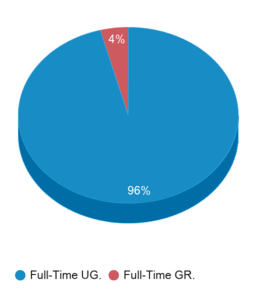
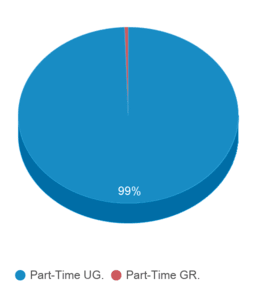
This chart displays the Full-time students and Part-time students enrollment breakdown of Rasmussen University-Illinois.
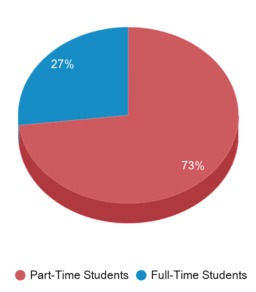
This chart displays community college average Full-Time students and Part-Time students enrollment breakdown of Illinois.
# Enrollment Undergraduate
364 students
328 students
# Full-Time Undergraduate Students
1,508 students
1,007 students
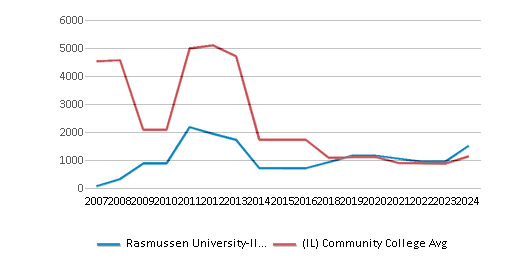
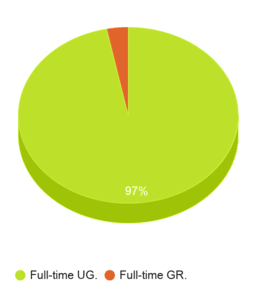
This chart displays the total number of Full-time undergraduate students enrollment of Rasmussen University-Illinois and average number of community college Full-time undergraduate  students enrollment of Illinois by year, with the latest 2023-24 school year data.
# Full-Time Graduate Students
49 students
43 students
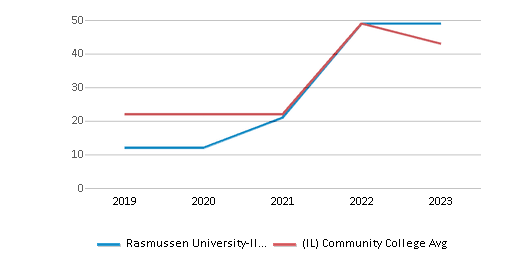
This chart displays the total number of Full-time graduate students enrollment of Rasmussen University-Illinois and average number of community college Full-time graduate students enrollment of Illinois by year, with the latest 2022-23 school year data.
This chart displays graduation rate breakdown of Rasmussen University-Illinois
Illinois All Graduation Breakdown
# Part-Time Undergraduate Students
2,135 students
3,310 students
# Part-Time Graduate Students
27 students
18 students
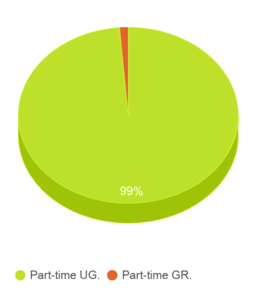
This chart displays graduation rate breakdown of Rasmussen University-Illinois
Illinois All Part Time Graduation Breakdown
Total Dormitory Capacity
n/a
132 students
% American Indian/Alaskan
n/a
n/a
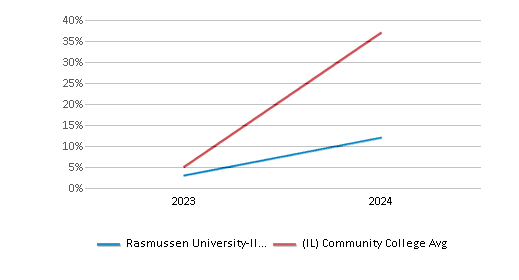
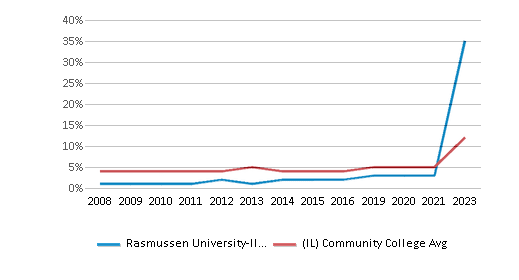
This chart displays the percentage of American Indian/Alaskan students in Rasmussen University-Illinois and the percentage of American Indian/Alaskan community college students in Illinois by year, with the latest 2023-24 school year data.
% Asian
3%
6%
This chart displays the percentage of Asian students in Rasmussen University-Illinois and the percentage of Asian community college students in Illinois by year, with the latest 2022-23 school year data.
% Hispanic
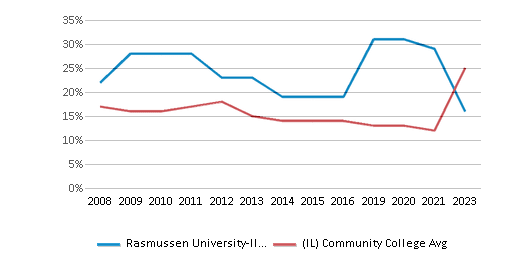
15%
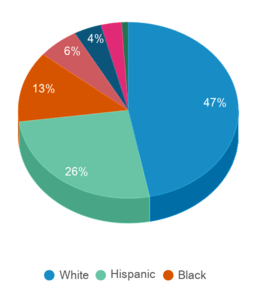
26%
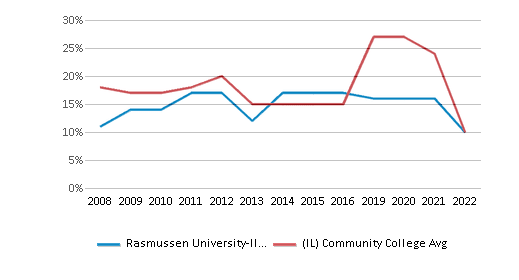
This chart displays the percentage of Hispanic students in Rasmussen University-Illinois and the percentage of Hispanic community college students in Illinois by year, with the latest 2021-22 school year data.
% Black
46%
13%
This chart displays the percentage of Black students in Rasmussen University-Illinois and the percentage of Black community college students in Illinois by year, with the latest 2022-23 school year data.
% White
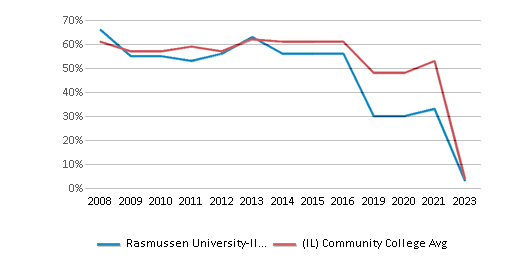
19%
47%
This chart displays the percentage of White students in Rasmussen University-Illinois and the percentage of White community college students in Illinois by year, with the latest 2022-23 school year data.
% Hawaiian
n/a
n/a
This chart displays the percentage of Hawaiian students in Rasmussen University-Illinois and the percentage of Hawaiian community college students in Illinois by year, with the latest 2023-24 school year data.
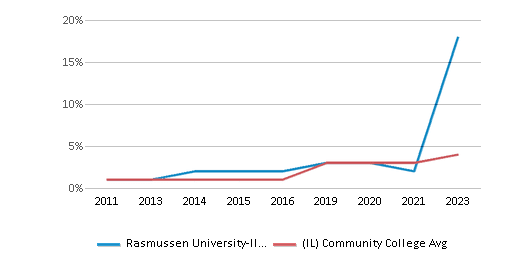
% Two or more races
2%
3%
This chart displays the percentage of Two or more races students in Rasmussen University-Illinois and the percentage of Two or more races community college students in Illinois by year, with the latest 2022-23 school year data.
% Non Resident races
n/a
1%
% Unknown races
14%
4%
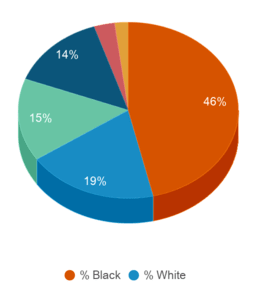
This chart displays the percentage breakdown of students of all ethnic groups in Rasmussen University-Illinois.
This chart displays the percentage breakdown of students of all ethnic groups in Illinois.
Diversity Score
0.73
0.69
This chart displays the diversity score of Rasmussen University-Illinois and the community college average diversity score of Illinois by year, with the latest 2022-23 school year data.
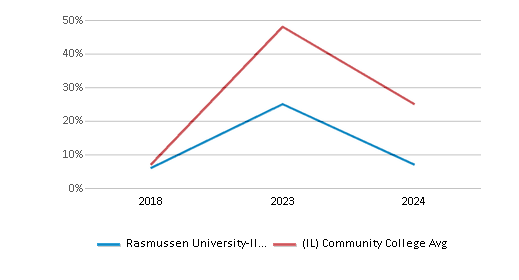
College Completion Rate (Students who graduate in less than 4 years) (Year 2010)
25%
25%
College Completion Rate (Students who graduate in 4 years or more than 4 years)
0.5495%
0.38%
Average Graduate Earnings (10 Years)
$33,100
$31,800
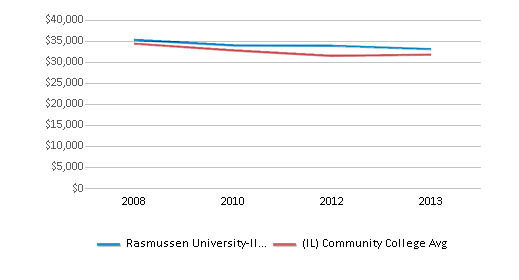
This chart displays average graduate earnings (10 Years) of Rasmussen University-Illinois and community college average graduate earnings (10 Years) of Illinois by year, disaggregated by student subgroups with the latest 2012-13 school year data.

Tuition and Acceptance Rate

The private state tuition of $10,764 is less than the state average of $14,511. The private state tuition has declined by 12% over four years.
Private State Tuition Fees
$10,764
$14,511
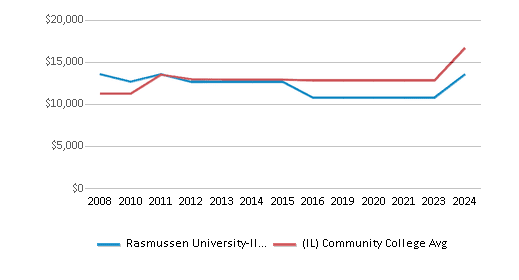
This chart displays tuition fees for an in-state student of Rasmussen University-Illinois and the private community college average tuition fees for an in-state student of Illinois by year, with the latest 2023-24 school year data.
% Students Receiving Some Financial Aid
97%
82%
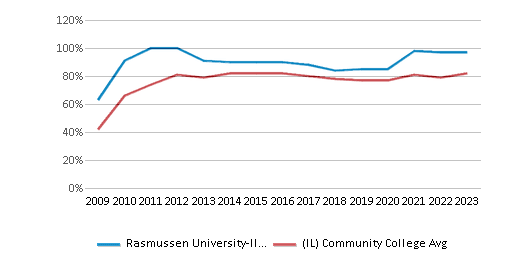
This chart displays the percent of students who is receiving some financial aid in Rasmussen University-Illinois and the percent of community college students who is receiving some financial aid in Illinois by year, with the latest 2022-23 school year data.
Median Debt for Graduates
$20,000
$8,187
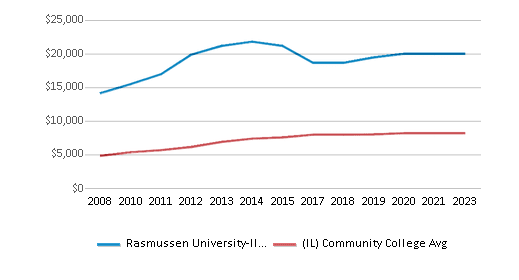
This chart displays median debt for students who have completed a certificate or degree in Rasmussen University-Illinois and average median debt for community college students who have completed a certificate or degree in Illinois by year, with the latest 2022-23 school year data.
Median Debt for Dropouts
$6,332
$4,618
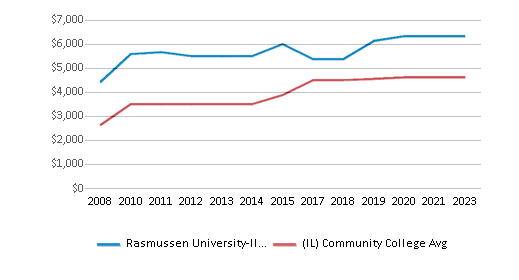
This chart displays median debt for students who have not completed a certificate or degree in Rasmussen University-Illinois and average median debt for community college students who have not completed a certificate or degree in Illinois by year, with the latest 2022-23 school year data.
Acceptance Rate
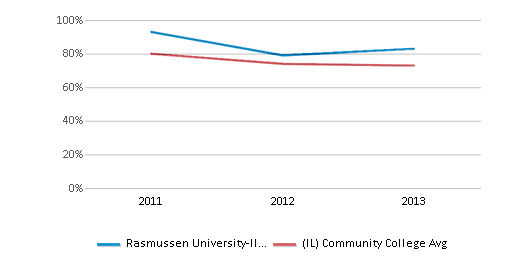
83%
73%
This chart displays the percent admitted of Rasmussen University-Illinois and the community college average percent admitted of Illinois by year, with the latest 2012-13 school year data.
SAT Reading
n/a
390
SAT Math
n/a
360
SAT Writing
n/a
355
ACT Composite
n/a
17
ACT English
n/a
17
ACT Math
n/a
17
Source: 2024 (or latest year available) Integrated Postsecondary Education Data System (IPEDS)

Frequently Asked Questions

How much does Rasmussen University-Illinois cost?
Rasmussen University-Illinois's private state tuition is approximately $10,764.
What is the acceptance rate of Rasmussen University-Illinois?
The acceptance rate of Rasmussen University-Illinois is 83%, which is higher than the state average of 73%.
What is Rasmussen University-Illinois's ranking?
Rasmussen University-Illinois ranks among the top 20% of community college in Illinois for: Diversity in US community colleges and Percent of students receiving financial aid.

Recent Articles

First Responders and Emergency Services: Specialized Roles and Training 
This comprehensive guide explores the evolving landscape of emergency services, highlighting key positions in firefighting, EMS, law enforcement, and specialized response teams. It emphasizes the growing demand for skilled professionals due to increasing environmental and security challenges, and outlines the crucial role of community colleges in providing necessary training and certifications.
Unlocking Airport Career Opportunities: Your Guide to Ground Jobs
Discover the diverse range of ground jobs at mid-size U.S. airports, their educational requirements, and how community colleges can prepare you for these exciting careers.
Adult Learners: Upgrading Your Skills
We offer straightforward advice on identifying transferable skills, exploring job opportunities, leveraging community resources, and embracing lifelong learning. With relatable examples and encouragement, this guide aims to empower readers to navigate the job market confidently and successfully transition into new careers.

Quick Stats (2025)

  • Enrollment: 3,643 students
  • Private-state tuition: $10,764
  • Acceptance Rate: 83%
  • Student:teacher ratio: 17:1
  • Minority enrollment: 81%
  • Source: Integrated Postsecondary Education Data System (IPEDS)

Did You Know?

For Illinois public community colleges, the average tuition is approximately $7,875 per year for in-state students and $10,847 for out-of-state students. For private community colleges, the average yearly tuition is approximately $14,511 per year. Read more about average community college tuition costs across the country.

The average community college acceptance rate in Illinois is 87%. Read more about national community college acceptance rates.

Illinois community colleges have a diversity score of 0.69, which is higher than the national average of 0.00. The most diverse community college in Illinois is Toyota Technological Institute at Chicago. Read more about community college diversity statistics in the USA.

Quick Links