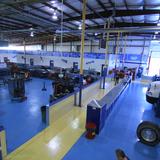
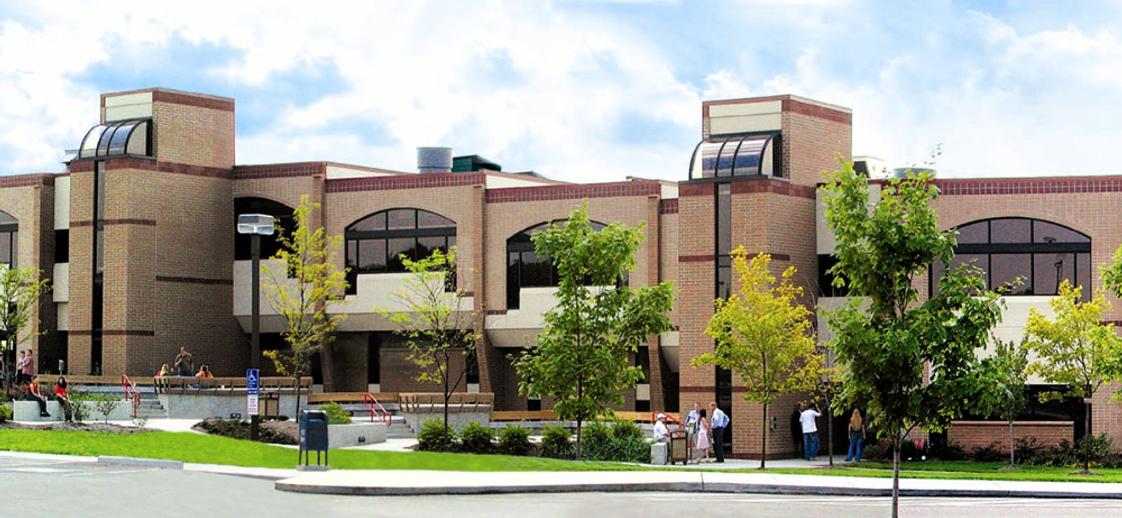
Pittsburgh Technical College Photo #0 - Pittsburgh Technical College's convenient locations on the outskirts of Pittsburgh mean you avoid the congestion but won't miss the action.

Pittsburgh Technical College (Closed 2024)

1111 McKee Road
Oakdale, PA 15071
  • With more than 30 degree and non-degree programs, Pittsburgh Technical College provides education that prepares our students for career success. The learning is immersive, project-based, and as real as it gets. 
  • All degree-seeking, on-site students have internships or clinical rotations before they graduate; 2 out of 3 available PTC students accepted job offers from their internship employers, and 97% of available graduates work in their career field.* 
  • PTC is a nonprofit institution. 
  • *Showcases graduates from 2017 classes. Data includes those who were available for work and were offered and/or received career search assistance from 1/1/2017-4/30/2018. Includes full-time, part-time, or freelance positions. Visit PTCollege.edu/employmentstats to learn more.

School Highlights

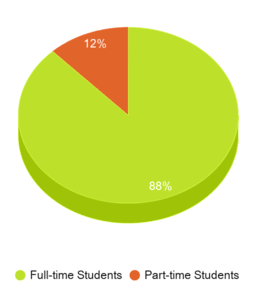
Pittsburgh Technical College served 1,424 students (88% of students were full-time).
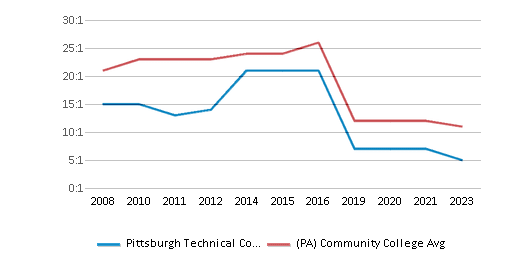
The college's student:teacher ratio of 6:1 was lower than the state community college average of 15:1.
Minority enrollment was 30% of the student body (majority Black), which was less than the state average of 48%.

School Overview

Pittsburgh Technical College
(PA) Community College Avg.
Carnegie Classification
Baccalaureate/Associate's Colleges: Associate's Dominant
Baccalaureate/Associate's Colleges: Mixed Baccalaureate/Associate's
Institution Level
Four or more years
At least 2 but less than 4 years
Institution Control
Private not-for-profit
Total Faculty
239 staff
58 staff
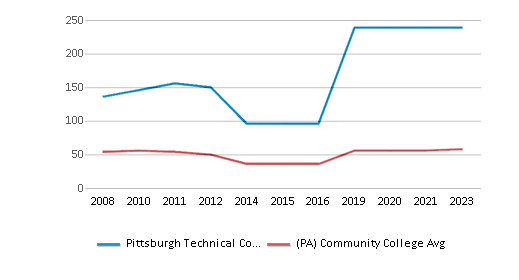
This chart displays total faculty of Pittsburgh Technical College and community college average number of faculty in Pennsylvania by year, with the latest 2022-23 school year data.
School Calendar

Student Body

Total Enrollment
1,424 students
361 students
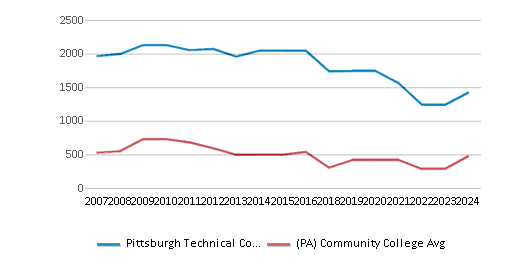
This chart displays the total enrollment of Pittsburgh Technical College and community college average number of enrollment of Pennsylvania by year, with the latest 2023-24 school year data.
Student : Teacher Ratio
6:1
15:1
This chart displays the student staff ratio of Pittsburgh Technical College and community college average student staff ratio of Pennsylvania by year, with the latest 2022-23 school year data.
# Full-Time Students
1,252 students
310 students
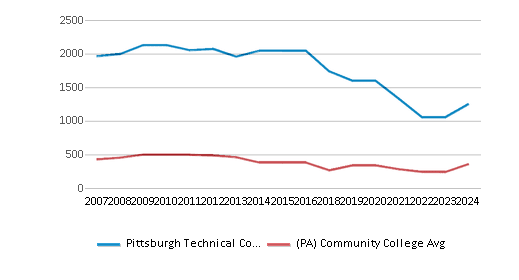
This chart displays the total number of Full-time students enrollment of Pittsburgh Technical College and average number of community college Full-time students enrollment of Pennsylvania by year, with the latest 2023-24 school year data.
# Part-Time Students
172 students
134 students
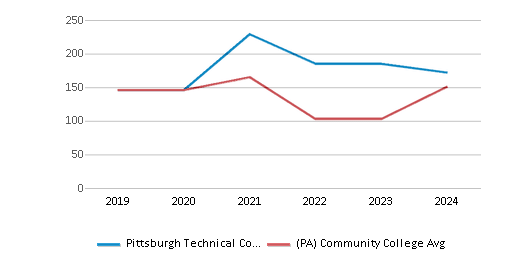
This chart displays the total number of Part-time students enrollment of Pittsburgh Technical College and average number of community college Part-time students enrollment of Pennsylvania by year, with the latest 2023-24 school year data.
This chart displays the Full-time students and Part-time students enrollment breakdown of Pittsburgh Technical College.
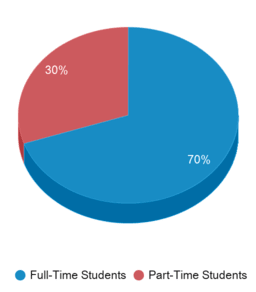
This chart displays community college average Full-Time students and Part-Time students enrollment breakdown of Pennsylvania.
# Enrollment Undergraduate
142 students
300 students
# Full-Time Undergraduate Students
1,252 students
300 students
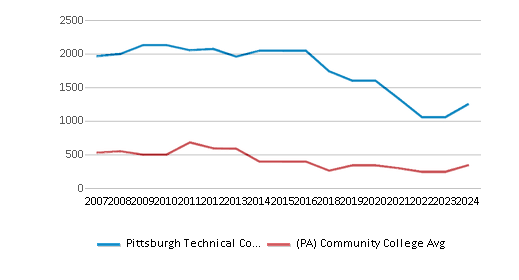
This chart displays the total number of Full-time undergraduate students enrollment of Pittsburgh Technical College and average number of community college Full-time undergraduate  students enrollment of Pennsylvania by year, with the latest 2023-24 school year data.
# Full-Time Graduate Students
n/a
10 students
# Part-Time Undergraduate Students
172 students
134 students
# Part-Time Graduate Students
n/a
12 students
Total Dormitory Capacity
494 students
330 students
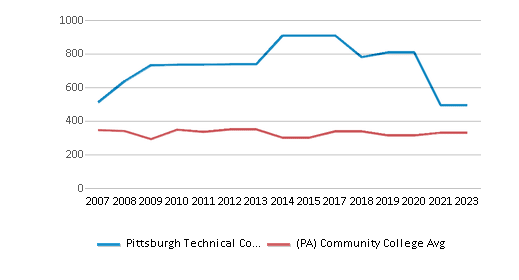
This chart displays the dormitory capacity of Pittsburgh Technical College and the community college average dormitory capacity of Pennsylvania by year, with the latest 2022-23 school year data.
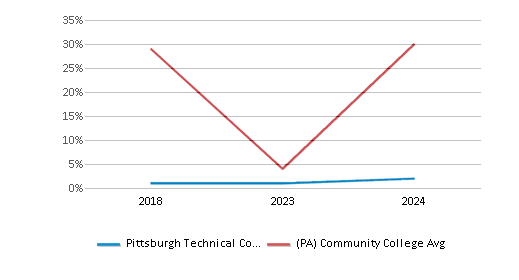
% American Indian/Alaskan
n/a
n/a
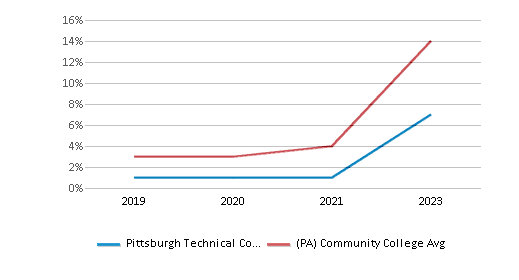
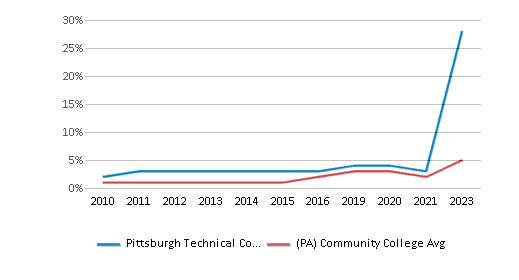
This chart displays the percentage of American Indian/Alaskan students in Pittsburgh Technical College and the percentage of American Indian/Alaskan community college students in Pennsylvania by year, with the latest 2023-24 school year data.
% Asian
1%
5%
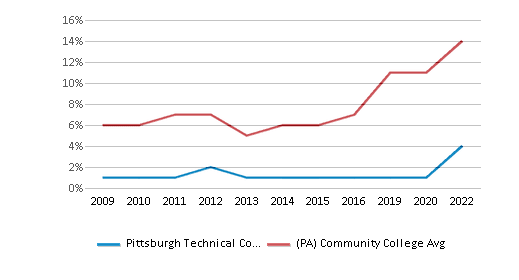
This chart displays the percentage of Asian students in Pittsburgh Technical College and the percentage of Asian community college students in Pennsylvania by year, with the latest 2022-23 school year data.
% Hispanic
2%
11%
This chart displays the percentage of Hispanic students in Pittsburgh Technical College and the percentage of Hispanic community college students in Pennsylvania by year, with the latest 2021-22 school year data.
% Black
10%
15%
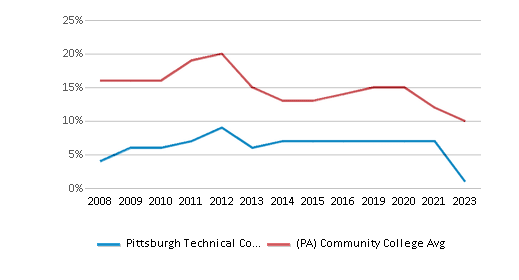
This chart displays the percentage of Black students in Pittsburgh Technical College and the percentage of Black community college students in Pennsylvania by year, with the latest 2022-23 school year data.
% White
70%
52%
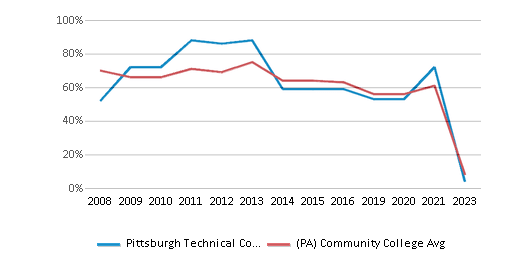
This chart displays the percentage of White students in Pittsburgh Technical College and the percentage of White community college students in Pennsylvania by year, with the latest 2022-23 school year data.
% Hawaiian
n/a
3%
This chart displays the percentage of Hawaiian students in Pittsburgh Technical College and the percentage of Hawaiian community college students in Pennsylvania by year, with the latest 2023-24 school year data.
% Two or more races
4%
3%
This chart displays the percentage of Two or more races students in Pittsburgh Technical College and the percentage of Two or more races community college students in Pennsylvania by year, with the latest 2022-23 school year data.
% Non Resident races
n/a
1%
% Unknown races
13%
10%
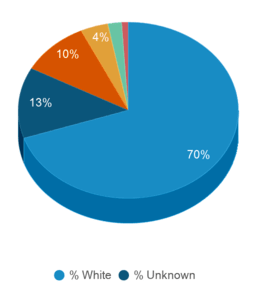
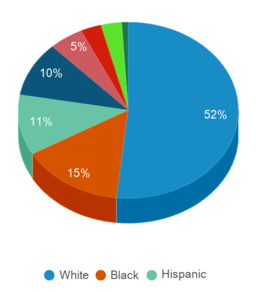
This chart displays the percentage breakdown of students of all ethnic groups in Pittsburgh Technical College.
This chart displays the percentage breakdown of students of all ethnic groups in Pennsylvania.
Diversity Score
0.50
0.68
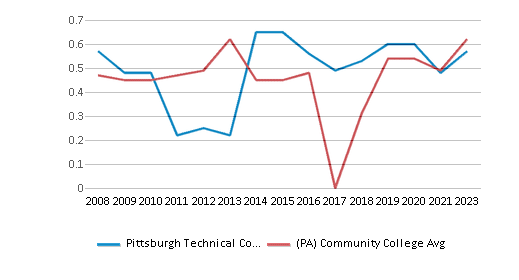
This chart displays the diversity score of Pittsburgh Technical College and the community college average diversity score of Pennsylvania by year, with the latest 2022-23 school year data.
College Completion Rate (Students who graduate in less than 4 years)
54%
59%
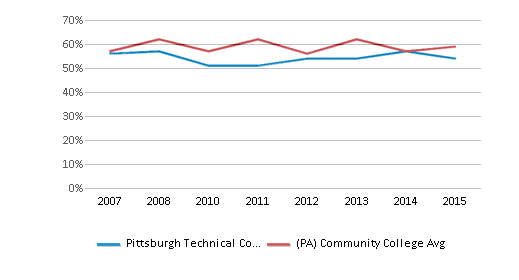
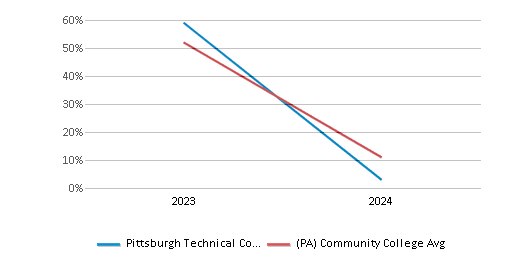
This chart displays completion rates for First-Time of Full-time students of Pittsburgh Technical College and community college average completion rates for First-Time of Full-time students of Pennsylvania by year, with the latest 2014-15 school year data.
College Completion Rate (Students who graduate in 4 years or more than 4 years)
0.5375%
0.3822%
Average Graduate Earnings (10 Years)
$37,300
$34,900
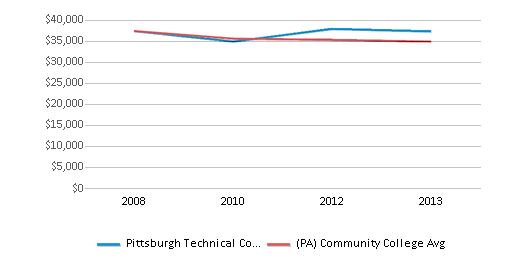
This chart displays average graduate earnings (10 Years) of Pittsburgh Technical College and community college average graduate earnings (10 Years) of Pennsylvania by year, disaggregated by student subgroups with the latest 2012-13 school year data.

Tuition and Acceptance Rate

Private State Tuition Fees
$15,657
$17,177
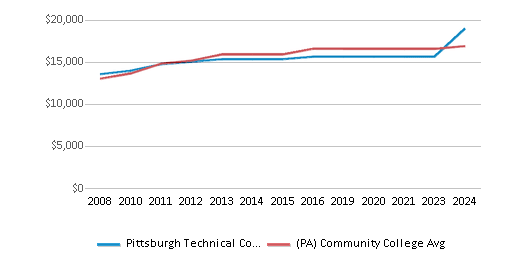
This chart displays tuition fees for an in-state student of Pittsburgh Technical College and the private community college average tuition fees for an in-state student of Pennsylvania by year, with the latest 2023-24 school year data.
% Students Receiving Some Financial Aid
97%
91%
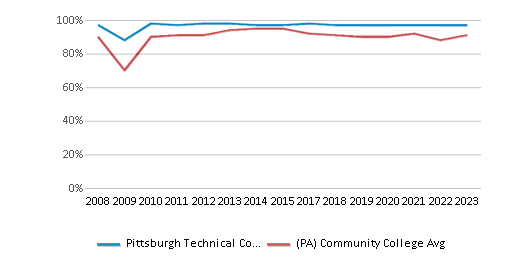
This chart displays the percent of students who is receiving some financial aid in Pittsburgh Technical College and the percent of community college students who is receiving some financial aid in Pennsylvania by year, with the latest 2022-23 school year data.
Median Debt for Graduates
$17,416
$13,620
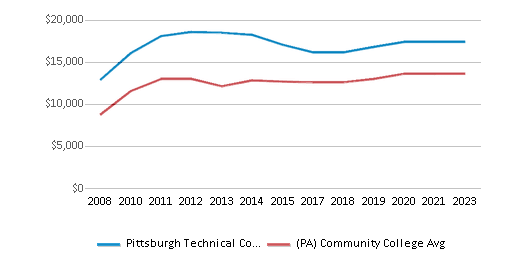
This chart displays median debt for students who have completed a certificate or degree in Pittsburgh Technical College and average median debt for community college students who have completed a certificate or degree in Pennsylvania by year, with the latest 2022-23 school year data.
Median Debt for Dropouts
$5,530
$6,234
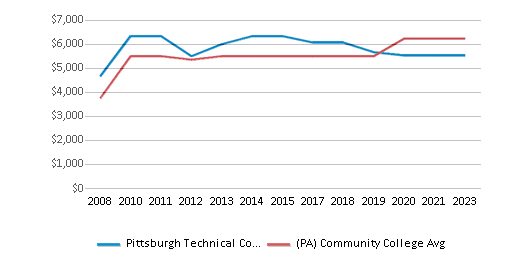
This chart displays median debt for students who have not completed a certificate or degree in Pittsburgh Technical College and average median debt for community college students who have not completed a certificate or degree in Pennsylvania by year, with the latest 2022-23 school year data.
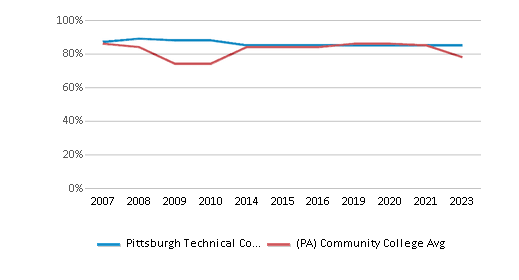
Acceptance Rate
85%
78%
This chart displays the percent admitted of Pittsburgh Technical College and the community college average percent admitted of Pennsylvania by year, with the latest 2022-23 school year data.
SAT Reading
n/a
460
SAT Math
n/a
470
SAT Writing
n/a
435
ACT Composite
n/a
20
ACT English
n/a
20
ACT Math
n/a
21
ACT Writing
n/a
7
Source: 2024 (or latest year available) Integrated Postsecondary Education Data System (IPEDS) , School Administrators

Frequently Asked Questions

How much does Pittsburgh Technical College cost?
Pittsburgh Technical College's private state tuition is approximately $15,657.
What is the acceptance rate of Pittsburgh Technical College?
The acceptance rate of Pittsburgh Technical College is 85%, which is higher than the state average of 78%.

Recent Articles

Obtaining Your Bachelor's Degree at a Community College
Explore the evolving landscape of community colleges offering bachelor's degrees, addressing affordability, accessibility, and workforce needs.
A to Z of Community College Certificates and Courses
From business and healthcare to technology and skilled trades, the article showcases the breadth of options available to students seeking to enhance their knowledge, develop new skills, or pursue career advancement.
What is a Community College?
This comprehensive guide explains what a community college is, its history, and its role in higher education. It covers the types of programs offered, differences from four-year colleges, benefits of attending, and important considerations for prospective students, providing valuable insights for those exploring educational options.

Did You Know?

The average community college acceptance rate in Allegheny County, PA is 74%. Read more about national community college acceptance rates.

Allegheny County, PA community colleges have a diversity score of 0.41, which is higher than the national average of 0.00. The most diverse community college in Allegheny County, PA is Triangle Tech Inc-Pittsburgh. Read more about community college diversity statistics in the USA.

Quick Links