Peirce College

1608 Walnut St., Suite 1900
Philadelphia, PA 19103
Top Ranked (2025): View Rankings

School Highlights

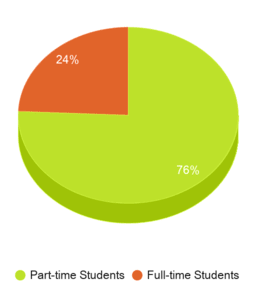
Peirce College serves 1,279 students (24% of students are full-time).
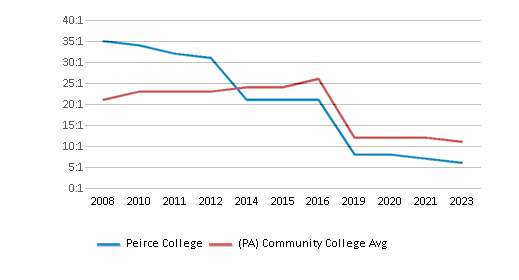
The college's student:teacher ratio of 8:1 is lower than the state community college average of 15:1.
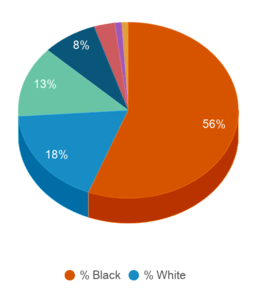
Minority enrollment is 82% of the student body (majority Black), which is more than the state average of 48%.

Quick Stats (2025)

  • Enrollment: 1,279 students
  • Private-state tuition: $13,800
  • Acceptance Rate: 100%
  • Student:teacher ratio: 8:1
  • Minority enrollment: 82%
  • Source: Integrated Postsecondary Education Data System (IPEDS)

Top Rankings

Peirce College ranks among the top 20% of public schools in Pennsylvania for:

Category
Attribute

School Overview

The teacher population of 153 teachers has stayed relatively flat over five years.
Peirce College
(PA) Community College Avg.
Carnegie Classification
Baccalaureate Colleges: Diverse Fields
Baccalaureate/Associate's Colleges: Mixed Baccalaureate/Associate's
Institution Level
Four or more years
At least 2 but less than 4 years
Institution Control
Private not-for-profit
Total Faculty
153 staff
58 staff
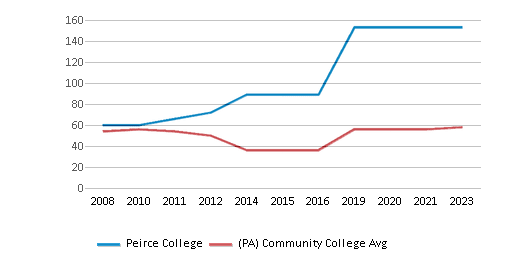
This chart displays total faculty of Peirce College and community college average number of faculty in Pennsylvania by year, with the latest 2022-23 school year data.

Student Body

The student population of Peirce College has grown by 8% over five years.
The student:teacher ratio of 8:1 has increased from 7:1 over five years.
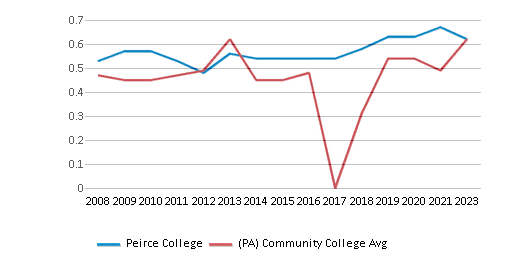
The Peirce College diversity score of 0.64 is less than the state average of 0.68. The school's diversity has stayed relatively flat over five years.
Total Enrollment
1,279 students
361 students
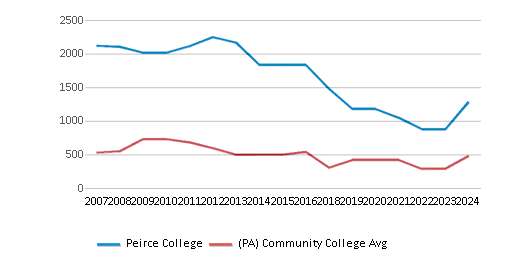
This chart displays the total enrollment of Peirce College and community college average number of enrollment of Pennsylvania by year, with the latest 2023-24 school year data.
Student : Teacher Ratio
8:1
15:1
This chart displays the student staff ratio of Peirce College and community college average student staff ratio of Pennsylvania by year, with the latest 2022-23 school year data.
# Full-Time Students
310 students
310 students
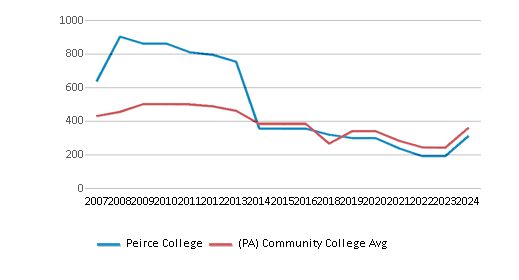
This chart displays the total number of Full-time students enrollment of Peirce College and average number of community college Full-time students enrollment of Pennsylvania by year, with the latest 2023-24 school year data.
# Part-Time Students
969 students
134 students
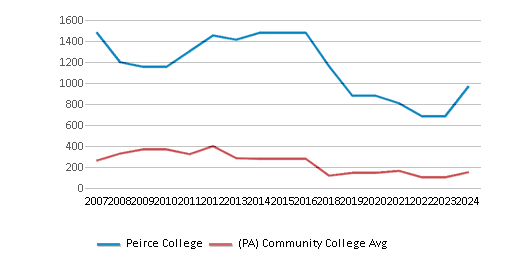
This chart displays the total number of Part-time students enrollment of Peirce College and average number of community college Part-time students enrollment of Pennsylvania by year, with the latest 2023-24 school year data.
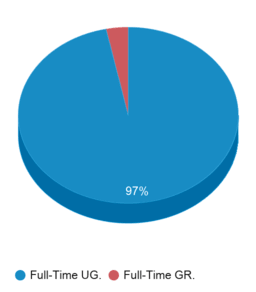
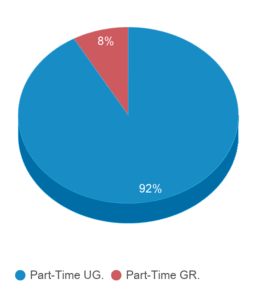
This chart displays the Full-time students and Part-time students enrollment breakdown of Peirce College.
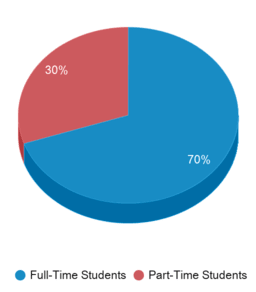
This chart displays community college average Full-Time students and Part-Time students enrollment breakdown of Pennsylvania.
# Enrollment Undergraduate
116 students
300 students
# Full-Time Undergraduate Students
300 students
300 students
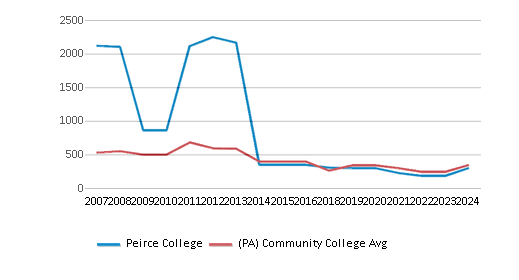
This chart displays the total number of Full-time undergraduate students enrollment of Peirce College and average number of community college Full-time undergraduate  students enrollment of Pennsylvania by year, with the latest 2023-24 school year data.
# Full-Time Graduate Students
10 students
10 students
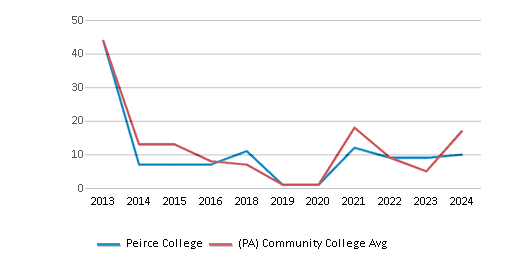
This chart displays the total number of Full-time graduate students enrollment of Peirce College and average number of community college Full-time graduate students enrollment of Pennsylvania by year, with the latest 2023-24 school year data.
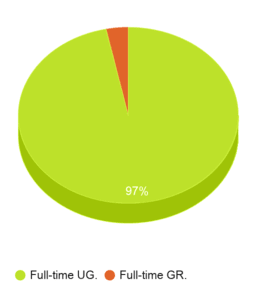
This chart displays graduation rate breakdown of Peirce College
Pennsylvania All Graduation Breakdown
# Part-Time Undergraduate Students
860 students
134 students
# Part-Time Graduate Students
109 students
12 students
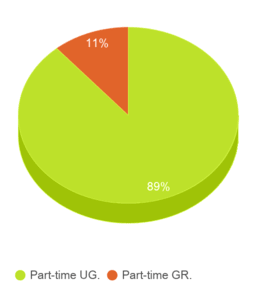
This chart displays graduation rate breakdown of Peirce College
Pennsylvania All Part Time Graduation Breakdown
Total Dormitory Capacity
n/a
330 students
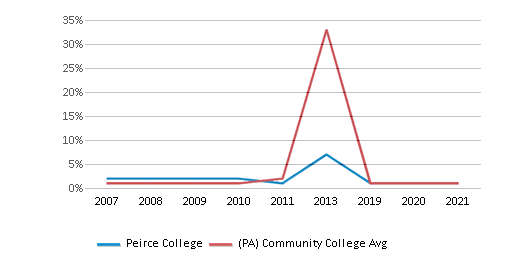
% American Indian/Alaskan
1%
n/a
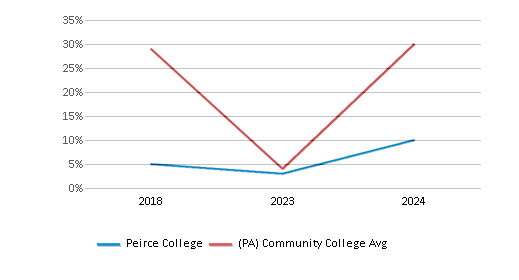
This chart displays the percentage of American Indian/Alaskan students in Peirce College and the percentage of American Indian/Alaskan community college students in Pennsylvania by year, with the latest 2023-24 school year data.
% Asian
3%
5%
This chart displays the percentage of Asian students in Peirce College and the percentage of Asian community college students in Pennsylvania by year, with the latest 2022-23 school year data.
% Hispanic
13%
11%
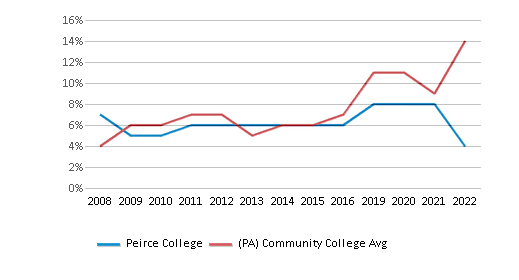
This chart displays the percentage of Hispanic students in Peirce College and the percentage of Hispanic community college students in Pennsylvania by year, with the latest 2021-22 school year data.
% Black
56%
15%
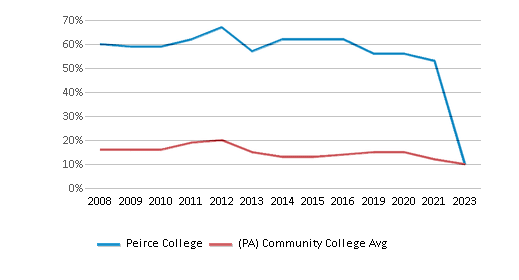
This chart displays the percentage of Black students in Peirce College and the percentage of Black community college students in Pennsylvania by year, with the latest 2022-23 school year data.
% White
18%
52%
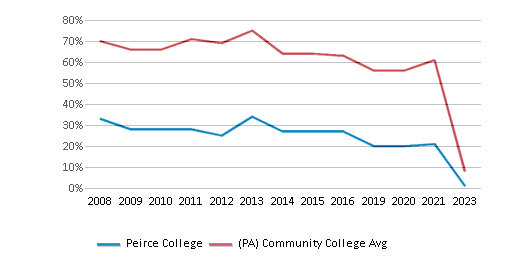
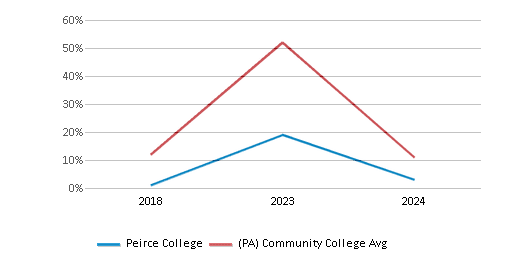
This chart displays the percentage of White students in Peirce College and the percentage of White community college students in Pennsylvania by year, with the latest 2022-23 school year data.
% Hawaiian
n/a
3%
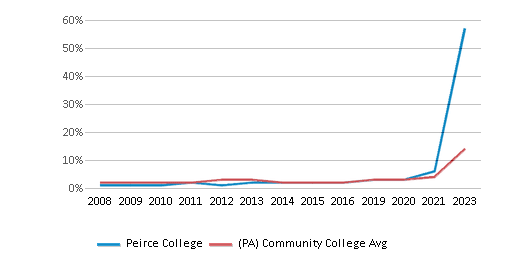
This chart displays the percentage of Hawaiian students in Peirce College and the percentage of Hawaiian community college students in Pennsylvania by year, with the latest 2023-24 school year data.
% Two or more races
1%
3%
This chart displays the percentage of Two or more races students in Peirce College and the percentage of Two or more races community college students in Pennsylvania by year, with the latest 2022-23 school year data.
% Non Resident races
n/a
1%
This chart displays the percentage of Non Resident students in Peirce College and the percentage of Non Resident community college students in Pennsylvania by year, with the latest 2020-21 school year data.
% Unknown races
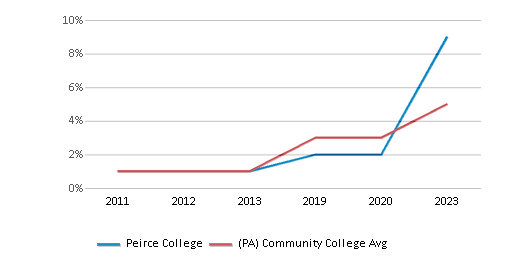
8%
10%
This chart displays the percentage breakdown of students of all ethnic groups in Peirce College.
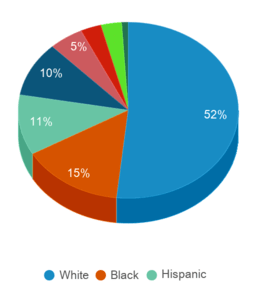
This chart displays the percentage breakdown of students of all ethnic groups in Pennsylvania.
Diversity Score
0.64
0.68
This chart displays the diversity score of Peirce College and the community college average diversity score of Pennsylvania by year, with the latest 2022-23 school year data.
College Completion Rate (Students who graduate in less than 4 years)
n/a
0.6111%
College Completion Rate (Students who graduate in 4 years or more than 4 years)
0.0526%
0.3822%
Average Graduate Earnings (10 Years)
$52,100
$34,900
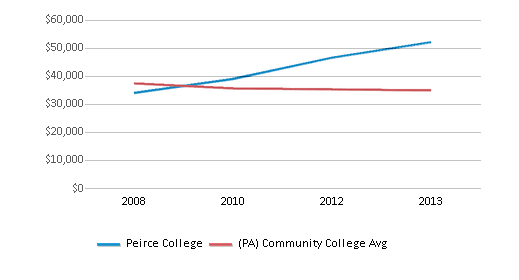
This chart displays average graduate earnings (10 Years) of Peirce College and community college average graduate earnings (10 Years) of Pennsylvania by year, disaggregated by student subgroups with the latest 2012-13 school year data.

Tuition and Acceptance Rate

The private state tuition of $13,800 is less than the state average of $17,177. The private state tuition has declined by 8% over four years.
Private State Tuition Fees
$13,800
$17,177
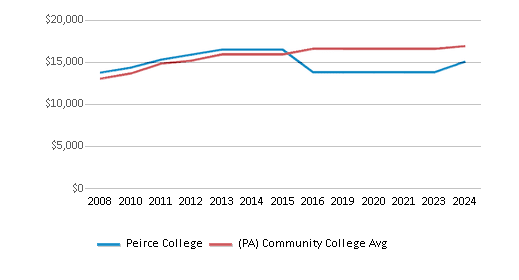
This chart displays tuition fees for an in-state student of Peirce College and the private community college average tuition fees for an in-state student of Pennsylvania by year, with the latest 2023-24 school year data.
% Students Receiving Some Financial Aid
100%
91%
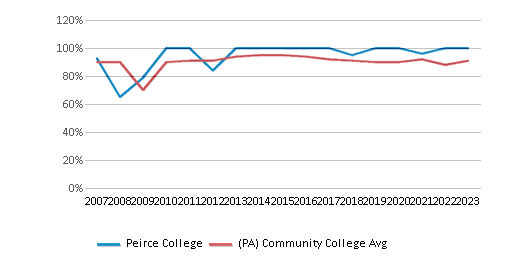
This chart displays the percent of students who is receiving some financial aid in Peirce College and the percent of community college students who is receiving some financial aid in Pennsylvania by year, with the latest 2022-23 school year data.
Median Debt for Graduates
$33,014
$13,620
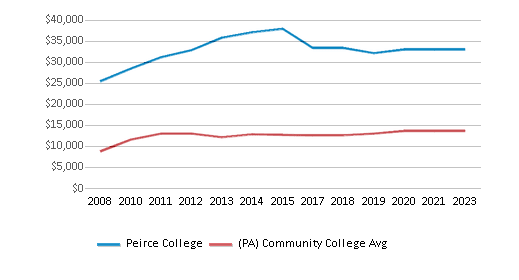
This chart displays median debt for students who have completed a certificate or degree in Peirce College and average median debt for community college students who have completed a certificate or degree in Pennsylvania by year, with the latest 2022-23 school year data.
Median Debt for Dropouts
$12,550
$6,234
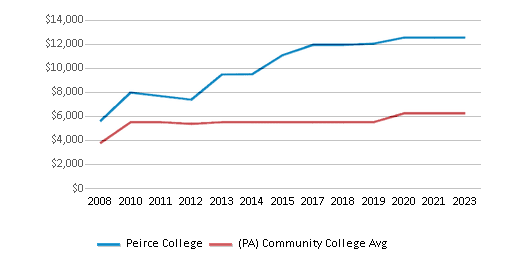
This chart displays median debt for students who have not completed a certificate or degree in Peirce College and average median debt for community college students who have not completed a certificate or degree in Pennsylvania by year, with the latest 2022-23 school year data.
Acceptance Rate
100%
76%
SAT Reading
n/a
460
SAT Math
n/a
470
SAT Writing
n/a
435
ACT Composite
n/a
20
ACT English
n/a
20
ACT Math
n/a
21
ACT Writing
n/a
7
Source: 2024 (or latest year available) Integrated Postsecondary Education Data System (IPEDS)

School Notes

  • Located in Philadelphia, Pennsylvania, Peirce College is one of the oldest accredited colleges offering a complete online degree program in the United States. Peirce offers its practical business and information technology management degrees online. Our three pronged educational delivery system approach – on campus, on site, online – has advanced dramatically, even beyond our own healthy projections. On campus refers to our facilities in the Center City business district of Philadelphia dating back to 1865. On site encompasses our array of degree offerings at employer, community, and school locations. Peirce Online is our expanding Internet mediated distance learning (IMDL) platform offering complete, accredited degrees. This triad provides a very strong foundation for long-term regional, national, and international growth. Peirce has earned its exceptional reputation as a leading provider of quality academic programs and undergraduate degrees in the areas of business, information technology and paralegal studies. A premier choice among working adults, Peirce offers options to make learning more convenient, including our online degree program, accelerated evening & weekend formats and The Peirce Corporate College, where individuals can earn a degree at their workplace. The College is authorized by the Pennsylvania Department of Education to award the Bachelor of Science and Associate in Science degrees. Peirce College is accredited by the Middle States Commission on Higher Education.

Frequently Asked Questions

How much does Peirce College cost?
Peirce College's private state tuition is approximately $13,800.
What is the acceptance rate of Peirce College?
The acceptance rate of Peirce College is 100%, which is higher than the state average of 76%.
What is Peirce College's ranking?
Peirce College ranks among the top 20% of community college in Pennsylvania for: Percent of students receiving financial aid.
In what neighborhood is Peirce College located?
Peirce College is located in the Rittenhouse Square neighborhood of Philadelphia, PA.

Recent Articles

First Responders and Emergency Services: Specialized Roles and Training 
This comprehensive guide explores the evolving landscape of emergency services, highlighting key positions in firefighting, EMS, law enforcement, and specialized response teams. It emphasizes the growing demand for skilled professionals due to increasing environmental and security challenges, and outlines the crucial role of community colleges in providing necessary training and certifications.
Unlocking Airport Career Opportunities: Your Guide to Ground Jobs
Discover the diverse range of ground jobs at mid-size U.S. airports, their educational requirements, and how community colleges can prepare you for these exciting careers.
Adult Learners: Upgrading Your Skills
We offer straightforward advice on identifying transferable skills, exploring job opportunities, leveraging community resources, and embracing lifelong learning. With relatable examples and encouragement, this guide aims to empower readers to navigate the job market confidently and successfully transition into new careers.

Quick Stats (2025)

  • Enrollment: 1,279 students
  • Private-state tuition: $13,800
  • Acceptance Rate: 100%
  • Student:teacher ratio: 8:1
  • Minority enrollment: 82%
  • Source: Integrated Postsecondary Education Data System (IPEDS)

Related School Videos

Did You Know?

Philadelphia County, PA community colleges have a diversity score of 0.64, which is higher than the national average of 0.00. The most diverse community college in Philadelphia County, PA is ASPIRA City College. Read more about community college diversity statistics in the USA.

Quick Links