- At Mission College, we have excellent transfer programs and general education courses that will promote your journey to four year institutions and prepare you for higher level learning whether it is the California State System, the University System or a Private University. We also have exemplary signature programs that help to prepare you for the workforce in many areas: Nursing, Fire Technology, Hospitality Management, and many others. Mission can provide classes that will catch you up in math, English, ESL or other areas that provide foundational skills to serve you in any future courses. Our faculty is among the most qualified in the state and our students appreciate the college for its friendly staff and supportive atmosphere. The staff at Mission College is uniquely poised to help and guide your path to the future.
School Highlights
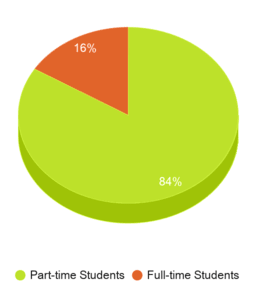
Mission College serves 10,088 students (16% of students are full-time).
The college's student:teacher ratio of 23:1 is lower than the state community college average of 32:1.
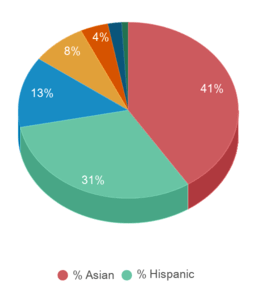
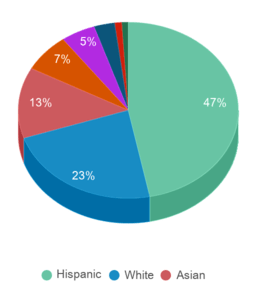
Minority enrollment is 87% of the student body (majority Asian), which is more than the state average of 77%.
Quick Stats (2025)
- Enrollment: 10,088 students
- In-state tuition: $1,174
- Out-state tuition: $6,070
- Student:teacher ratio: 23:1
- Minority enrollment: 87%
- Source: Integrated Postsecondary Education Data System (IPEDS)
School Overview
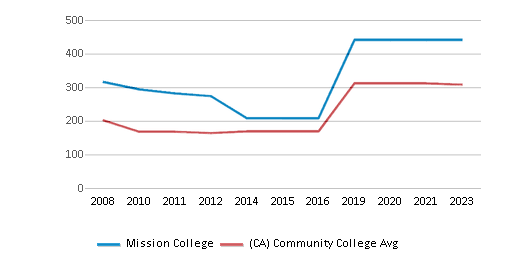
The teacher population of 441 teachers has stayed relatively flat over five years.
Mission College
(CA) Community College Avg.
Carnegie Classification
Associate's Colleges: High Transfer-Mixed Traditional/Nontraditional
Baccalaureate/Associate's Colleges: Associate's Dominant
Institution Level
At least 2 but less than 4 years
At least 2 but less than 4 years
Institution Control
Public
Public
Total Faculty
441 staff
294 staff
School Calendar
Student Body
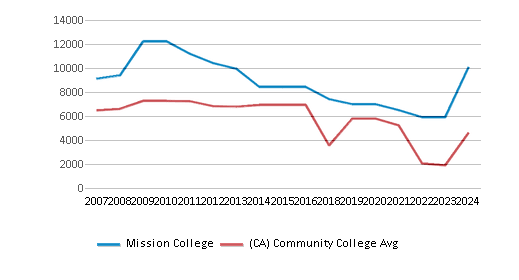
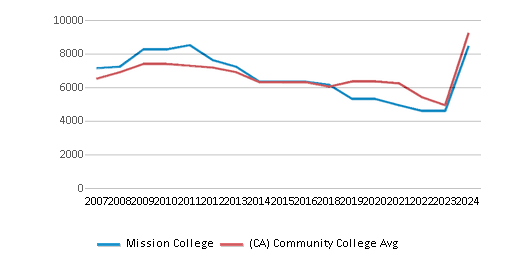
The student population of Mission College has grown by 44% over five years.
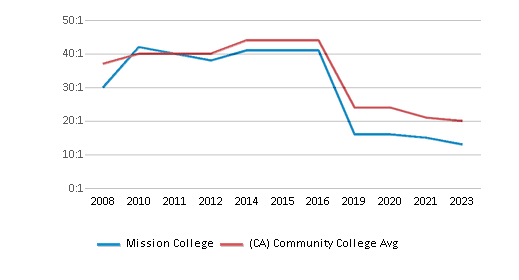
The student:teacher ratio of 23:1 has increased from 15:1 over five years.
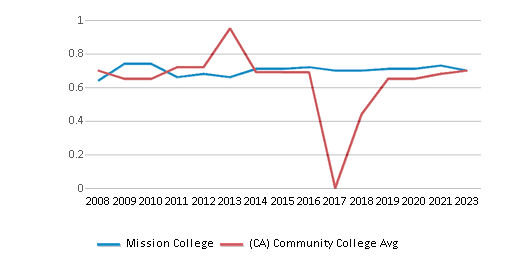
The Mission College diversity score of 0.71 is more than the state average of 0.70. The school's diversity has stayed relatively flat over five years.
Total Enrollment
10,088 students
2,311 students
Student : Teacher Ratio
23:1
32:1
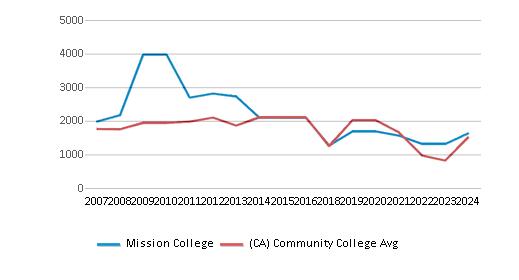
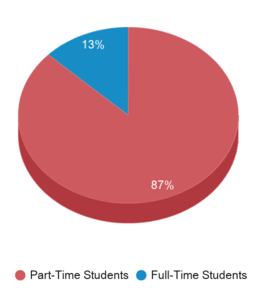
# Full-Time Students
1,631 students
1,232 students
# Part-Time Students
8,457 students
8,299 students
# Enrollment Undergraduate
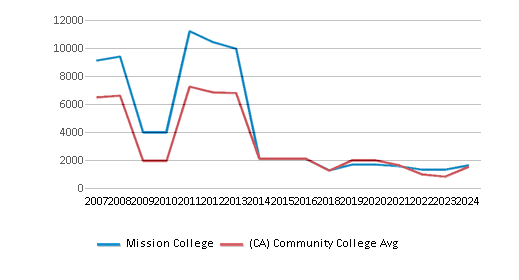
100 students
240 students
# Full-Time Undergraduate Students
1,631 students
1,155 students
# Full-Time Graduate Students
n/a
63 students
# Part-Time Undergraduate Students
8,457 students
8,457 students
# Part-Time Graduate Students
n/a
10 students
Total Dormitory Capacity
n/a
140 students
% American Indian/Alaskan
n/a
n/a
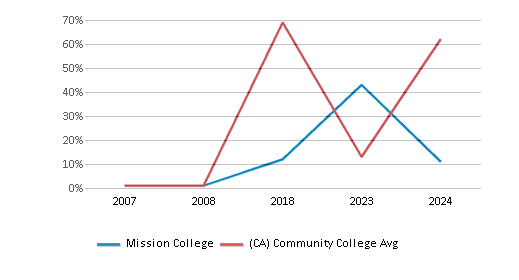
% Asian
41%
13%
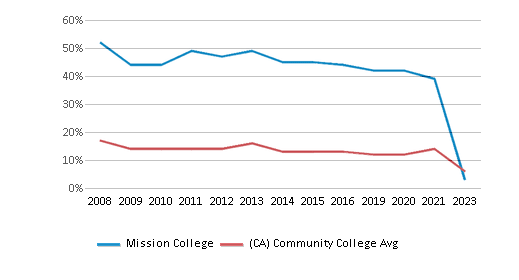
% Hispanic
31%
47%
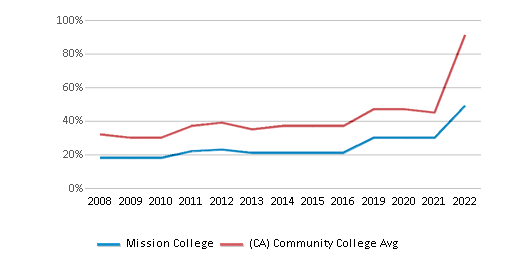
% Black
4%
7%
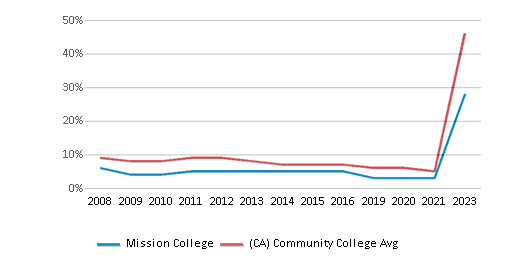
% White
13%
23%
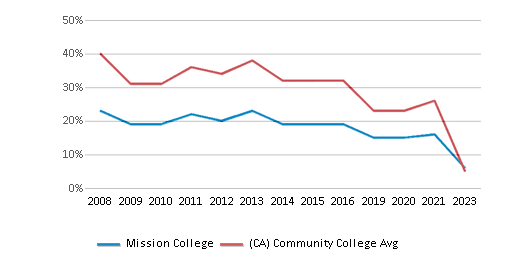
% Hawaiian
n/a
1%
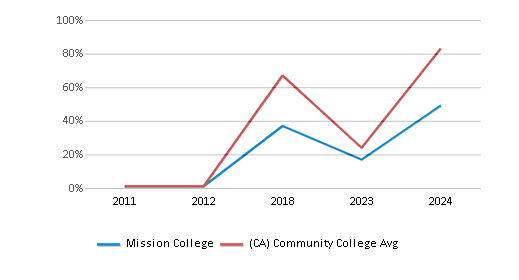
% Two or more races
8%
5%
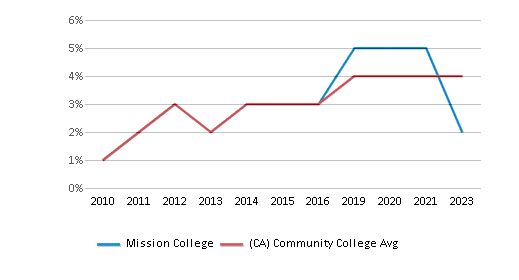
% Non Resident races
1%
1%
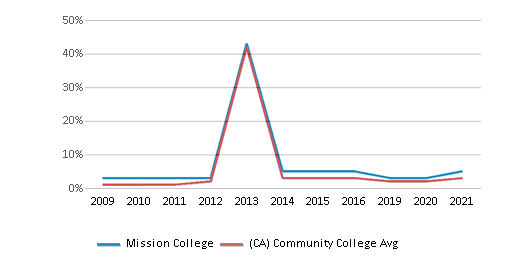
% Unknown races
2%
3%
Diversity Score
0.71
0.70
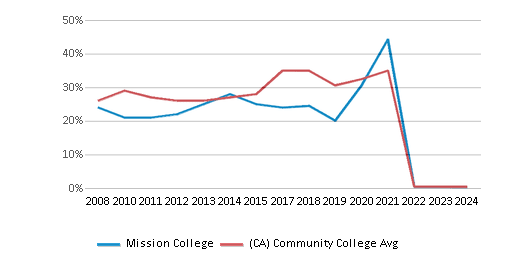
College Completion Rate (Students who graduate in less than 4 years)
0.3438%
0.4221%
College Completion Rate (Students who graduate in 4 years or more than 4 years)
n/a
0.4304%
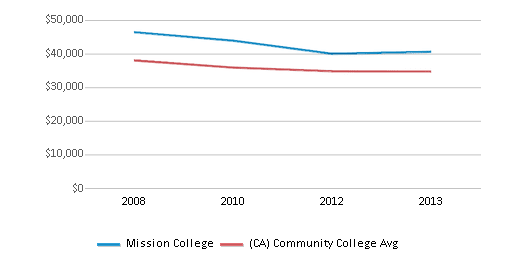
Average Graduate Earnings (10 Years)
$40,600
$34,700
Tuition and Acceptance Rate
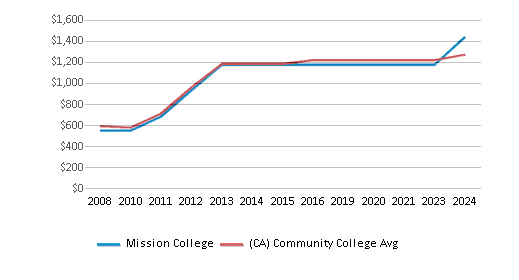
The public in-state tuition of $1,174 is less than the state average of $1,236. The in-state tuition has stayed relatively flat over four years.
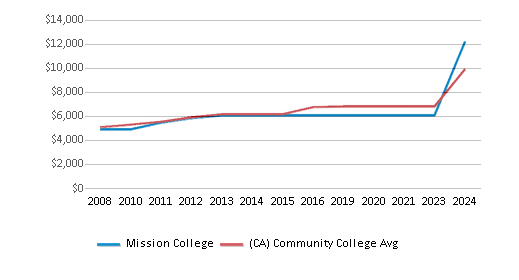
The public out-state tuition of $6,070 is less than the state average of $6,547. The out-state tuition has declined by 5% over four years.
In-State Tuition Fees
$1,174
$1,236
Out-State Tuition Fees
$6,070
$6,547
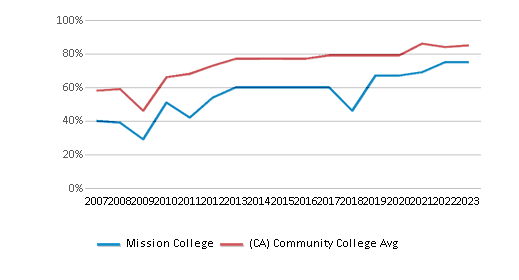
% Students Receiving Some Financial Aid
75%
85%
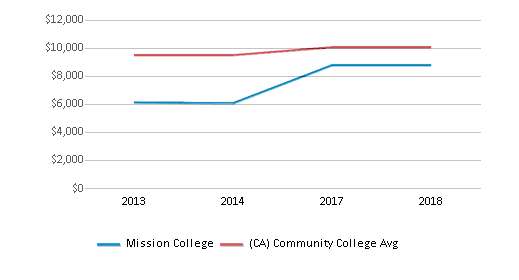
Median Debt for Graduates
$8,779
$10,063
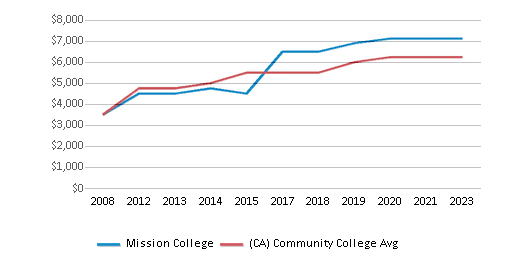
Median Debt for Dropouts
$7,125
$6,239
Acceptance Rate
n/a
92%
Source: 2024 (or latest year available) Integrated Postsecondary Education Data System (IPEDS)
School Notes
- Mission College is an open access community college serving the ever-changing educational and economic development needs of Santa Clara, Silicon Valley, and the larger community. Seeking to develop community leaders and global stewards in a competitive world economy, the college provides transfer, degree, and certificate programs in lower division arts and sciences; community, career, and vocational education; and educational opportunities in basic skills and English as a Second Language. To accomplish its mission, the college provides the most advanced academic and technological resources, comprehensive student services, and enriching aesthetic experiences to help students succeed and to participate responsibly in a democratic society. Each semester over 10,000 students enroll in over 1,300 day, evening, and weekend classes at Mission College. The educational opportunities at Mission College are extensive. Students can fulfill lower division general education and major requirements for a university baccalaureate degree, obtain an Associate of Arts or Associate of Science degree, complete a career program leading to employment, upgrade skills for career advancement, or take classes for personal satisfaction and growth. Mission College enrolls 11,000 students each year. Of these, approximately 80% are ethnic minorities. The average student age is 30 and a significant number are working adults attending college part time. Mission is located in the heart of Silicon Valley and has working partnerships with high tech companies such as Intel and Cisco Systems. Mission is part of the West Valley-Mission Community College District, a multi-college district based in Saratoga, California. The mission of the West Valley-Mission Community College District is to be responsive to the educational needs of an ever-changing community and to provide higher education to all persons who can benefit from such activity. The District recognized its responsibility to maintain academic excellence, nurture individual development and enrich the community. In keeping with this mission, the District will be sensitive to the needs of people and committed to action focused on the future.
Frequently Asked Questions
How much does Mission College cost?
Mission College's tuition is approximately $1,174 for In-State students and $6,070 for Out-State students.
Recent Articles

Obtaining Your Bachelor's Degree at a Community College
Explore the evolving landscape of community colleges offering bachelor's degrees, addressing affordability, accessibility, and workforce needs.

A to Z of Community College Certificates and Courses
From business and healthcare to technology and skilled trades, the article showcases the breadth of options available to students seeking to enhance their knowledge, develop new skills, or pursue career advancement.

What is a Community College?
This comprehensive guide explains what a community college is, its history, and its role in higher education. It covers the types of programs offered, differences from four-year colleges, benefits of attending, and important considerations for prospective students, providing valuable insights for those exploring educational options.


