- The mission of Illinois Eastern Community Colleges District 529 is to provide excellence in teaching, learning, public service, and economic development. The District is committed to high academic standards for pre-baccalaureate, career and technical education that sustain and advance excellence in learning.
School Highlights
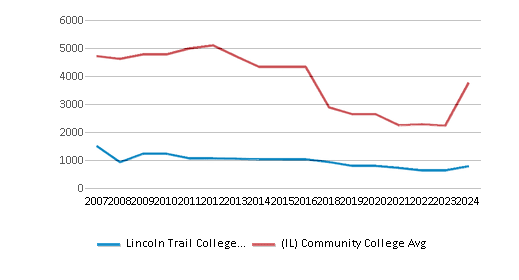
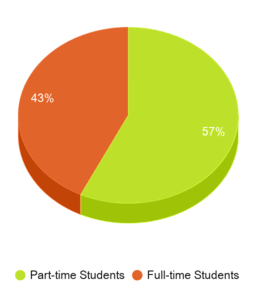
Lincoln Trail College serves 781 students (43% of students are full-time).
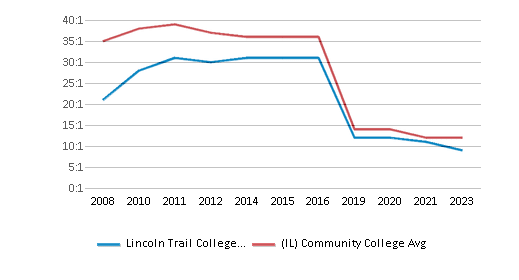
The college's student:teacher ratio of 12:1 is lower than the state community college average of 21:1.
Minority enrollment is 15% of the student body (majority Hispanic), which is less than the state average of 53%.
Quick Stats (2025)
- Enrollment: 781 students
- In-state tuition: $9,079
- Out-state tuition: $11,070
- Student:teacher ratio: 12:1
- Minority enrollment: 15%
- Source: Integrated Postsecondary Education Data System (IPEDS)
Top Rankings
Lincoln Trail College ranks among the top 20% of public schools in Illinois for:
Category
Attribute
School Resources
School Overview
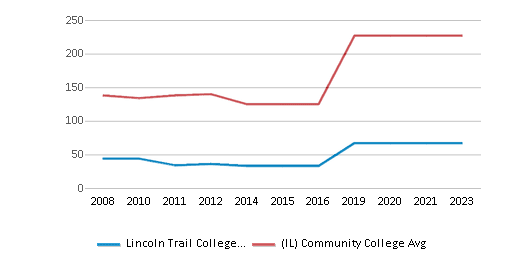
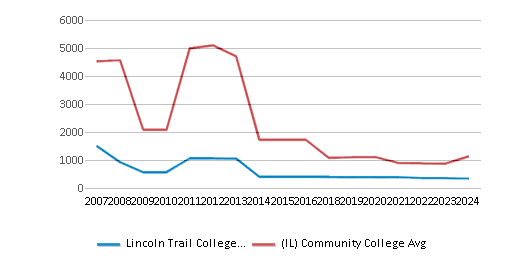
The teacher population of 67 teachers has stayed relatively flat over five years.
Lincoln Trail College
(IL) Community College Avg.
Carnegie Classification
Associate's Colleges: High Transfer-Mixed Traditional/Nontraditional
Associate's Colleges: Mixed Transfer/Career & Technical-High Nontraditional
Institution Level
At least 2 but less than 4 years
At least 2 but less than 4 years
Institution Control
Public
Public
Total Faculty
67 staff
227 staff
School Calendar
Student Body
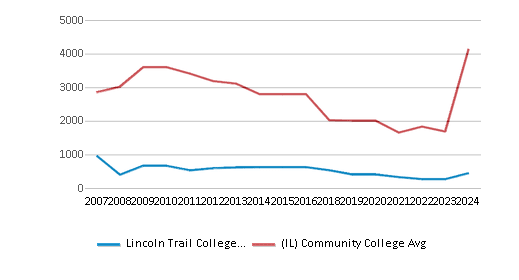
The student population of Lincoln Trail College has stayed relatively flat over five years.
The student:teacher ratio of 12:1 has increased from 11:1 over five years.
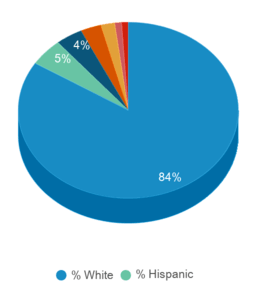
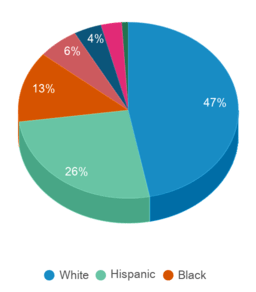
The Lincoln Trail College diversity score of 0.27 is less than the state average of 0.69. The school's diversity has grown by 44% over five years.
Total Enrollment
781 students
3,270 students
Student : Teacher Ratio
12:1
21:1
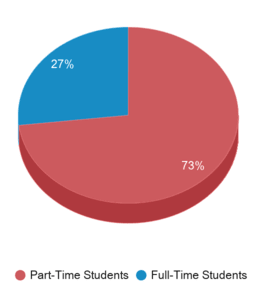
# Full-Time Students
335 students
1,007 students
# Part-Time Students
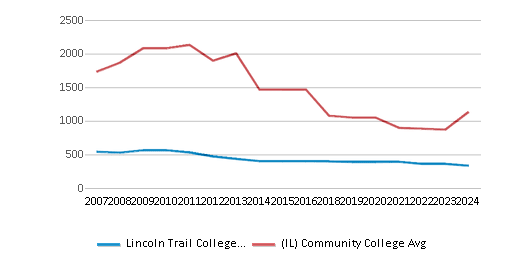
446 students
2,747 students
# Enrollment Undergraduate
781 students
328 students
# Full-Time Undergraduate Students
335 students
1,007 students
# Full-Time Graduate Students
n/a
43 students
# Part-Time Undergraduate Students
446 students
3,310 students
# Part-Time Graduate Students
n/a
18 students
Total Dormitory Capacity
n/a
132 students
% American Indian/Alaskan
n/a
n/a
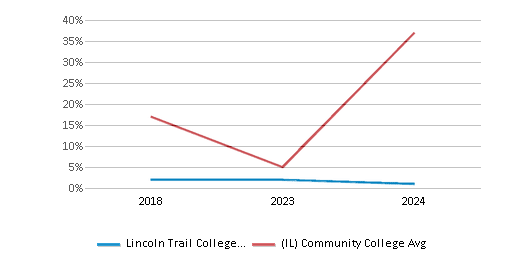
% Asian
1%
6%
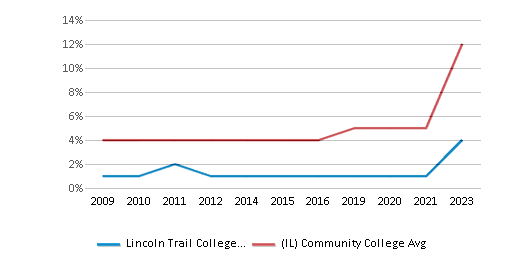
% Hispanic
5%
26%
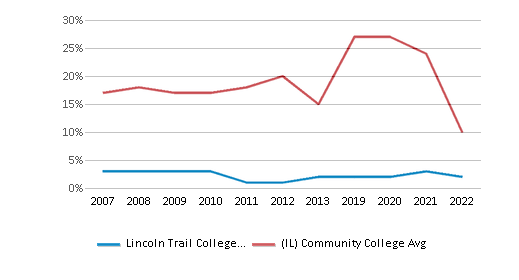
% Black
3%
13%
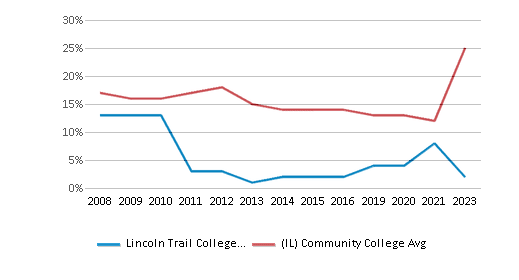
% White
85%
47%
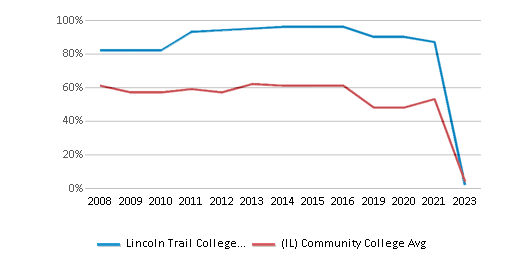
% Hawaiian
1%
n/a
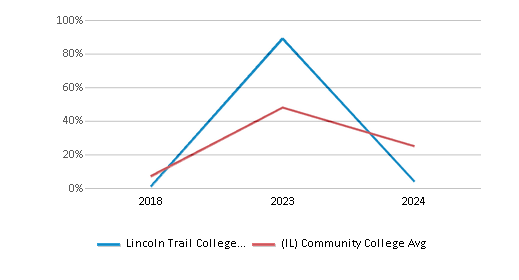
% Two or more races
2%
3%
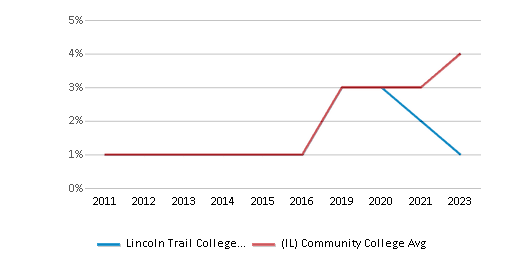
% Non Resident races
n/a
1%
% Unknown races
4%
4%
Diversity Score
0.27
0.69
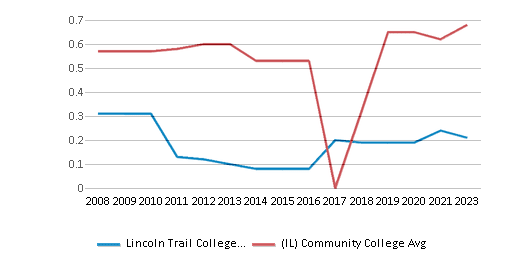
College Completion Rate (Students who graduate in less than 4 years)
0.5263%
0.4%
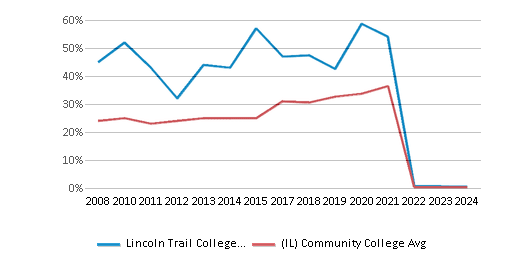
College Completion Rate (Students who graduate in 4 years or more than 4 years)
n/a
0.38%
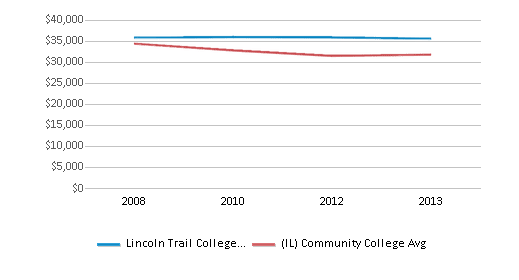
Average Graduate Earnings (10 Years)
$35,600
$31,800
Tuition and Acceptance Rate
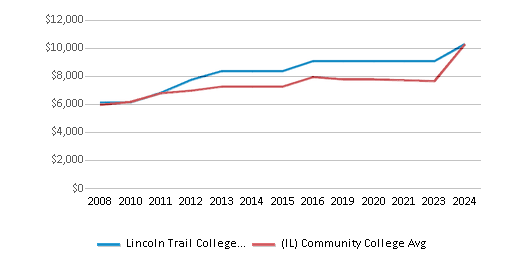
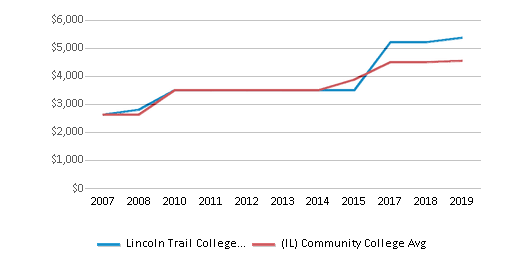
The public in-state tuition of $9,079 is more than the state average of $7,875. The in-state tuition has declined by 9% over four years.
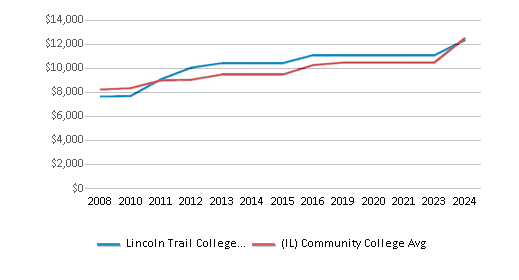
The public out-state tuition of $11,070 is more than the state average of $10,847. The out-state tuition has declined by 8% over four years.
In-State Tuition Fees
$9,079
$7,875
Out-State Tuition Fees
$11,070
$10,847
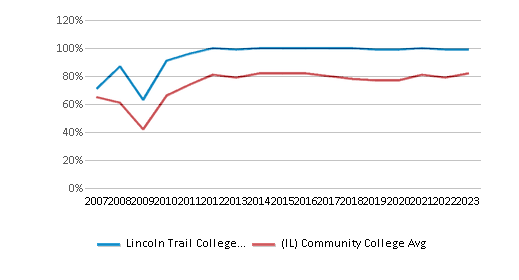
% Students Receiving Some Financial Aid
99%
82%
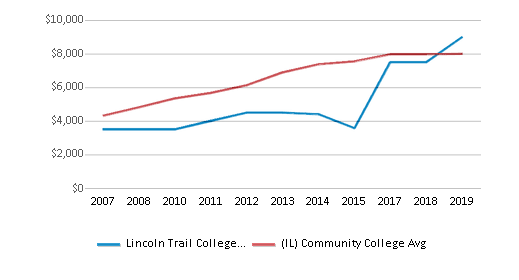
Median Debt for Graduates
$9,000
$8,000
Median Debt for Dropouts
$5,373
$4,549
Acceptance Rate
n/a
89%
SAT Reading
n/a
390
SAT Math
n/a
360
SAT Writing
n/a
355
ACT Composite
n/a
17
ACT English
n/a
17
ACT Math
n/a
17
Source: 2024 (or latest year available) Integrated Postsecondary Education Data System (IPEDS)
School Notes
- Illinois Eastern Community Colleges District #529 (IECC) is located in a 3,000 square-mile area of southeastern Illinois near the Illinois-Indiana border. The multi-college District includes Frontier Community College at Fairfield, Lincoln Trail College at Robinson, Olney Central College at Olney, and Wabash Valley College at Mt. Carmel. The first three colleges combined in 1969 to form what is now known as the Illinois Eastern Community Colleges District 529. Lincoln Trail College, an institution of Illinois Eastern Community Colleges District 529, was overwhelmingly approved by public referendum in October 1969 and is recognized as an Illinois Class I Community College. Three other community-oriented institutions (Olney Central College in Olney, Wabash Valley College in Mt. Carmel and Frontier Community College in Fairfield) complete the higher education structure of District 529. IECC is the only downstate multicollege district. Initial operation of LTC began in Fall 1969 with college-level instruction offered under the auspices of the Evening Division of IECC District 529. Classes were conducted in facilities provided by the local community, with approximately 300 students taking advantage of higher education in the immediate Lincoln Trail area. In Fall 1970, there were 682 students and the first classes were taught on the campus. Located on Highway 1, the campus site of 280 acres was purchased in January 1970. The college facilities of more than 130,000 square feet include a classroom and laboratory building, a physical education complex, and a third building composed of the Eagleton Learning Resource Center, the large group instruction theater (the Zwermann Arts Center), the Lincoln Room and the Student Center. The permanent campus was first occupied in Fall 1973. The Harry L. Crisp Educational Center (Telecommunications Technology Program) is located at LTC-South Campus, one-half mile south of the junction of Illinois Routes 1 and 33. Lincoln Trail College offers degrees and certificate in Administrative Information Tech (AIT), Basic Nurse Assistant Training Progr (BAID), Corrections - Parole Officer (CORPO), Corrections - Youth Supervisor (CORYS), Desktop Publishing (INFO), Horticulture (HORT), Horticulture Certficiate (HORT), Industrial Management (INDMG), Manufacturing Skills (INDMG), Medical Assistant (MEDA), Microcomputer Support Specialist Degree (MSS), Microsoft Computer Systems Engineer (MCSE) (MSS), Nursing (NUR), Office Management (OMGT), Paraprofessional Educator (EDU), Paraprofessional Educator (EDU), Pharmacy Technician (PHM), Supervisory Skills (INDMG), Telecom Outside Plant/Interconnect (TELCS), Telecommunications Technology Web Design Certificate (INFO) and Workplace Skills (INDMG).
Frequently Asked Questions
How much does Lincoln Trail College cost?
Lincoln Trail College's tuition is approximately $9,079 for In-State students and $11,070 for Out-State students.
What schools are Lincoln Trail College often compared to?
Lincoln Trail Collegeis often viewed alongside schools like Olney Central College, Frontier Community College by visitors of our site.
What is Lincoln Trail College's ranking?
Lincoln Trail College ranks among the top 20% of community college in Illinois for: Percent of students receiving financial aid.
Recent Articles

Obtaining Your Bachelor's Degree at a Community College
Explore the evolving landscape of community colleges offering bachelor's degrees, addressing affordability, accessibility, and workforce needs.

A to Z of Community College Certificates and Courses
From business and healthcare to technology and skilled trades, the article showcases the breadth of options available to students seeking to enhance their knowledge, develop new skills, or pursue career advancement.

What is a Community College?
This comprehensive guide explains what a community college is, its history, and its role in higher education. It covers the types of programs offered, differences from four-year colleges, benefits of attending, and important considerations for prospective students, providing valuable insights for those exploring educational options.


