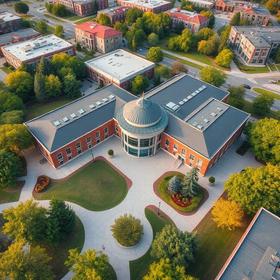
Lincoln College of Technology-Nashville

  • Nashville Auto-Diesel College (NADC) was established in 1919. Our first course of training was auto mechanics. Originally, students came only from the Nashville area but our market area has gradually expanded to include all 50 states and 62 foreign countries. In 1935, we added the diesel engine to our curriculum, and in 1946, we added Collision Repair and Refinishing Technology (Body and Fender). In our history we have also taught Radio Repair, Refrigeration, and Air Conditioning. We have been approved for the training of veterans since 1946, and about 30 states use our school for the training of the disabled through vocational rehabilitation.

School Highlights

Lincoln College of Technology-Nashville serves 1,833 students (100% of students are full-time).
The college's student:teacher ratio of 12:1 is lower than the state community college average of 18:1.
Minority enrollment is 46% of the student body (majority Black), which is more than the state average of 45%.

Quick Stats (2025)

  • Enrollment: 1,833 students
  • Acceptance Rate: 48%
  • Student:teacher ratio: 12:1
  • Minority enrollment: 46%
  • Source: Integrated Postsecondary Education Data System (IPEDS)

School Overview

The teacher population of 153 teachers has stayed relatively flat over five years.
Lincoln College of Technology-Nashville
(TN) Community College Avg.
Carnegie Classification
Special Focus Two-Year: Technical Professions
Not applicable, not in Carnegie universe (not accredited or nondegree-granting)
Institution Level
At least 2 but less than 4 years
Institution Control
Private for-profit
Public
Total Faculty
153 staff
81 staff
This chart displays total faculty of Lincoln College of Technology-Nashville and community college average number of faculty in Tennessee by year, with the latest 2022-23 school year data.
Number of Programs Offered
10
11

Student Body

The student population of Lincoln College of Technology-Nashville has grown by 15% over five years.
The student:teacher ratio of 12:1 has increased from 11:1 over five years.
The Lincoln College of Technology-Nashville diversity score of 0.61 is less than the state average of 0.65. The school's diversity has grown by 8% over five years.
Total Enrollment
1,833 students
605 students
This chart displays the total enrollment of Lincoln College of Technology-Nashville and community college average number of enrollment of Tennessee by year, with the latest 2023-24 school year data.
Student : Teacher Ratio
12:1
18:1
This chart displays the student staff ratio of Lincoln College of Technology-Nashville and community college average student staff ratio of Tennessee by year, with the latest 2022-23 school year data.
# Full-Time Students
1,833 students
400 students
This chart displays the total number of Full-time students enrollment of Lincoln College of Technology-Nashville and average number of community college Full-time students enrollment of Tennessee by year, with the latest 2023-24 school year data.
# Part-Time Students
n/a
230 students
This chart displays the Full-time students and Part-time students enrollment breakdown of Lincoln College of Technology-Nashville.
This chart displays community college average Full-Time students and Part-Time students enrollment breakdown of Tennessee.
# Enrollment Undergraduate
183 students
504 students
# Full-Time Undergraduate Students
1,833 students
400 students
This chart displays the total number of Full-time undergraduate students enrollment of Lincoln College of Technology-Nashville and average number of community college Full-time undergraduate  students enrollment of Tennessee by year, with the latest 2023-24 school year data.
# Full-Time Graduate Students
n/a
12 students
# Part-Time Undergraduate Students
n/a
335 students
# Part-Time Graduate Students
n/a
12 students
Total Dormitory Capacity
698 students
195 students
This chart displays the dormitory capacity of Lincoln College of Technology-Nashville and the community college average dormitory capacity of Tennessee by year, with the latest 2022-23 school year data.
% American Indian/Alaskan
n/a
n/a
This chart displays the percentage of American Indian/Alaskan students in Lincoln College of Technology-Nashville and the percentage of American Indian/Alaskan community college students in Tennessee by year, with the latest 2023-24 school year data.
% Asian
n/a
4%
This chart displays the percentage of Asian students in Lincoln College of Technology-Nashville and the percentage of Asian community college students in Tennessee by year, with the latest 2022-23 school year data.
% Hispanic
12%
6%
This chart displays the percentage of Hispanic students in Lincoln College of Technology-Nashville and the percentage of Hispanic community college students in Tennessee by year, with the latest 2021-22 school year data.
% Black
28%
19%
This chart displays the percentage of Black students in Lincoln College of Technology-Nashville and the percentage of Black community college students in Tennessee by year, with the latest 2022-23 school year data.
% White
54%
55%
This chart displays the percentage of White students in Lincoln College of Technology-Nashville and the percentage of White community college students in Tennessee by year, with the latest 2022-23 school year data.
% Hawaiian
n/a
9%
This chart displays the percentage of Hawaiian students in Lincoln College of Technology-Nashville and the percentage of Hawaiian community college students in Tennessee by year, with the latest 2023-24 school year data.
% Two or more races
3%
3%
This chart displays the percentage of Two or more races students in Lincoln College of Technology-Nashville and the percentage of Two or more races community college students in Tennessee by year, with the latest 2022-23 school year data.
% Non Resident races
n/a
1%
This chart displays the percentage of Non Resident students in Lincoln College of Technology-Nashville and the percentage of Non Resident community college students in Tennessee by year, with the latest 2017-18 school year data.
% Unknown races
2%
3%
This chart displays the percentage breakdown of students of all ethnic groups in Lincoln College of Technology-Nashville.
This chart displays the percentage breakdown of students of all ethnic groups in Tennessee.
Diversity Score
0.61
0.65
This chart displays the diversity score of Lincoln College of Technology-Nashville and the community college average diversity score of Tennessee by year, with the latest 2022-23 school year data.
College Completion Rate (Students who graduate in less than 4 years)
0.5469%
0.6038%
This chart displays completion rates for First-Time of Full-time students of Lincoln College of Technology-Nashville and community college average completion rates for First-Time of Full-time students of Tennessee by year, with the latest 2023-24 school year data.
College Completion Rate (Students who graduate in 4 years or more than 4 years)
n/a
0.5213%
Average Graduate Earnings (10 Years)
$32,300
$29,000
This chart displays average graduate earnings (10 Years) of Lincoln College of Technology-Nashville and community college average graduate earnings (10 Years) of Tennessee by year, disaggregated by student subgroups with the latest 2012-13 school year data.

Tuition and Acceptance Rate

% Students Receiving Some Financial Aid
95%
97%
This chart displays the percent of students who is receiving some financial aid in Lincoln College of Technology-Nashville and the percent of community college students who is receiving some financial aid in Tennessee by year, with the latest 2022-23 school year data.
Median Debt for Graduates
$11,730
$11,730
This chart displays median debt for students who have completed a certificate or degree in Lincoln College of Technology-Nashville and average median debt for community college students who have completed a certificate or degree in Tennessee by year, with the latest 2022-23 school year data.
Median Debt for Dropouts
$4,750
$5,250
This chart displays median debt for students who have not completed a certificate or degree in Lincoln College of Technology-Nashville and average median debt for community college students who have not completed a certificate or degree in Tennessee by year, with the latest 2022-23 school year data.
Acceptance Rate
48%
71%
This chart displays the percent admitted of Lincoln College of Technology-Nashville and the community college average percent admitted of Tennessee by year, with the latest 2009-10 school year data.
SAT Reading
n/a
415
SAT Math
n/a
455
SAT Writing
n/a
469
ACT Composite
n/a
20
ACT English
n/a
19
ACT Math
n/a
19
Source: 2024 (or latest year available) Integrated Postsecondary Education Data System (IPEDS)

School Notes

  • NADC recently joined Lincoln Educational Services and became one of their 32 campus locations in 15 different states. NADC serves as the corporation's Nashville Campus. Our reputation as one of the nation's top schools for auto-diesel and collision repair and refinishing technical training has been earned over our 86-year history. Career training programs currently offered at NADC includes Associate of Applied Science Degree Programs: Automotive and Diesel Technology and Auto Body Repair Technology. Diploma Programs includes Automotive and Diesel Technology, Auto Body Repair Technology and High-Performance. NADC provides a full service all-you-can-eat cafeteria, 2 on-campus dormitories and available off-campus apartments.

Frequently Asked Questions

What schools are Lincoln College of Technology-Nashville often compared to?
Lincoln College of Technology-Nashvilleis often viewed alongside schools like Nashville State Community College by visitors of our site.
What is the acceptance rate of Lincoln College of Technology-Nashville?
The acceptance rate of Lincoln College of Technology-Nashville is 48%, which is lower than the state average of 71%.
In what neighborhood is Lincoln College of Technology-Nashville located?
Lincoln College of Technology-Nashville is located in the East Nashville neighborhood of Nashville, TN.

Recent Articles

Careers: Broadcasting
Take advantage of career opportunities in the field of radio broadcasting by starting your training at your local community college.
Unlocking Airport Career Opportunities: Your Guide to Ground Jobs
Discover the diverse range of ground jobs at mid-size U.S. airports, their educational requirements, and how community colleges can prepare you for these exciting careers.
Adult Learners: Upgrading Your Skills
We offer straightforward advice on identifying transferable skills, exploring job opportunities, leveraging community resources, and embracing lifelong learning. With relatable examples and encouragement, this guide aims to empower readers to navigate the job market confidently and successfully transition into new careers.

Quick Stats (2025)

  • Enrollment: 1,833 students
  • Acceptance Rate: 48%
  • Student:teacher ratio: 12:1
  • Minority enrollment: 46%
  • Source: Integrated Postsecondary Education Data System (IPEDS)

Related School Videos

Did You Know?

Davidson County, TN community colleges have a diversity score of 0.63, which is higher than the national average of 0.00. The most diverse community college in Davidson County, TN is Remington College-Nashville Campus. Read more about community college diversity statistics in the USA.

Quick Links