- Bryant & Stratton was founded 150 years ago to provide practical workplace education. The requirements of the workplace have continuously evolved since our founding and, as we transition from the industrial to the information age, the evolution has accelerated. Keeping abreast of these contemporary needs requires the college to continuously revise and enhance curriculum, modify outcomes, and embrace or develop new teaching and learning methodologies.
School Highlights
Bryant & Stratton College-Richmond serves 741 students (53% of students are full-time).
The college's student-teacher ratio of 21:1 is lower than the state community college average of 23:1.
Minority enrollment is 79% of the student body (majority Black), which is more than the state average of 53%.
Quick Facts (2026)
- Enrollment: 741 students
- Private-state tuition: $16,052
- Acceptance Rate: 75%
- Student-teacher ratio: 21:1
- Minority enrollment: 79%
- Source: Verified school update
School Overview
The teacher population of 36 teachers has stayed relatively flat over five years.
Bryant & Stratton College-Richmond
(VA) Community College Avg.
Carnegie Classification
Baccalaureate/Associate's Colleges: Mixed Baccalaureate/Associate's
Associate's Colleges: Mixed Transfer/Career & Technical-Mixed Traditional/Nontraditional
Institution Level
Four or more years
At least 2 but less than 4 years
Institution Control
Private, non-profit
Public
Total Faculty
36 staff
129 staff
School Calendar
Student Body
The student population of Bryant & Stratton College-Richmond has stayed relatively flat over five years.
The student-teacher ratio of 21:1 has increased from 17:1 over five years.
The Bryant & Stratton College-Richmond diversity score of 0.59 is less than the state average of 0.71. The school's diversity has stayed relatively flat over five years.
Total Enrollment
741 students
1,608 students
Student-Teacher Ratio
21:1
23:1
# Full-Time Students
390 students
637 students
# Part-Time Students
351 students
971 students
# Enrollment Undergraduate
987 students
314 students
# Full-Time Undergraduate Students
390 students
611 students
# Full-Time Graduate Students
n/a
158 students
# Part-Time Undergraduate Students
351 students
971 students
# Part-Time Graduate Students
n/a
61 students
Total Dormitory Capacity
n/a
476 students
% American Indian/Alaskan
1%
n/a
% Asian
2%
8%
% Hispanic
5%
13%
% Black
60%
21%
% White
21%
47%
% Two or more races
5%
5%
% Non Resident races
5%
2%
% Unknown races
1%
4%
Diversity Score
0.59
0.71
College Completion Rate (Students who graduate in less than 4 years)
n/a
41%
College Completion Rate (Students who graduate in 4 years or more than 4 years)
n/a
26%
Average Graduate Earnings (10 Years)
$24,300
$29,600
Tuition and Acceptance Rate
The private state tuition of $16,052 is more than the state average of $15,536. The private state tuition has stayed relatively flat over four years.
Private State Tuition Fees
$16,052
$15,536
% Students Receiving Some Financial Aid
92%
77%
Median Debt for Graduates
$20,909
$11,000
Median Debt for Dropouts
$7,500
$5,500
Acceptance Rate
75%
59%
Source: 2023 (or latest year available) Integrated Postsecondary Education Data System (IPEDS) , School Administrators
School Notes
- School Mascot: Bobcats
- For well over a century, Bryant & Stratton's fundamental mission has been to provide individuals with skills that are immediately transferable to the workplace and to help them develop in their careers. From Dr. J. C. Bryant's Business Practice "learning lab" of the 1850's to the Active Learning of today, and from early correspondence courses conducted via mail to online education and training conducted via the Internet, Bryant & Stratton has evolved into an educational institution poised for the 21st century, committed to the same principles set forth by its founders. Bryant & Stratton College's 15 degree programs provide you with cutting edge skills as well as real-world experience, giving you a decided advantage in fields with exciting futures. Through accelerated degree programs and flexible schedules, including day, evening, weekend or online courses, Bryant & Stratton College can get you into the workforce faster – a career-focused approach that has helped 90% of recent Bryant & Stratton College graduates find placement within their chosen fields. With more than 150 years of teaching experience, Bryant & Stratton offers a variety of Bachelors and Associate degrees at 15 different campus locations. Degrees offered at Richmond Campus includes Accounting, Administrative Assistant, BA - General Management, BA - Information Technology, Business, Criminal Justice, Human Resources Specialist, Information Technology, Medical Assisting and Paralegal Studies.
Frequently Asked Questions
How much does Bryant & Stratton College-Richmond cost?
Bryant & Stratton College-Richmond's private state tuition is approximately $16,052.
What is the acceptance rate of Bryant & Stratton College-Richmond?
The acceptance rate of Bryant & Stratton College-Richmond is 75%, which is higher than the state average of 59%.
Recent Articles

5 Key Community College Trends Parents Should Know in 2026
Explore major 2026 community college trends including enrollment changes, costs, career programs, and affordability for parents planning college decisions.

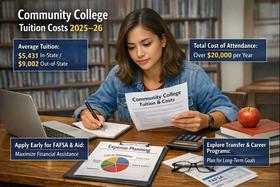
Average Community College Tuition Cost 2026 Update
Explore updated 2026 community college tuition averages, cost trends, planning tips, admissions timing advice, and financial strategies for families and students.

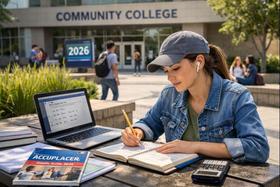
Preparing for Placement Tests in 2026: Student Guide
Preparing for Placement Tests in 2026, what students, parents, and educators need to know about formats, prep strategies, and placement changes.


