- Williamsburg Technical College, a member of the South Carolina Technical and Comprehensive Education system, is a public, two year, associate degree, diploma and certificate granting institution with an average semester enrollment of approximately 625 students serving the county of Williamsburg, South Carolina. The mission of Williamsburg Technical College is to offer quality, affordable and accessible educational opportunities and experiences that enable students to acquire the knowledge and skills to achieve their goals and to encourage economic development in Williamsburg County.
School Highlights
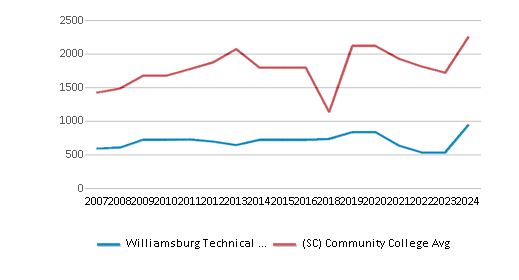
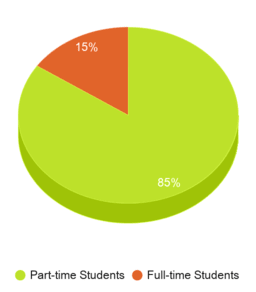
Williamsburg Technical College serves 943 students (15% of students are full-time).
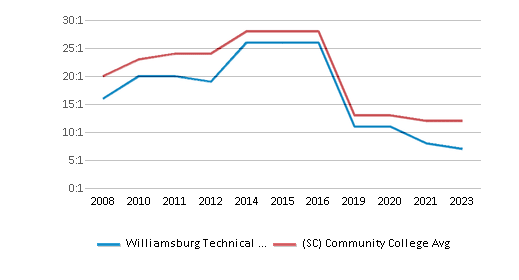
The college's student:teacher ratio of 12:1 is lower than the state community college average of 18:1.
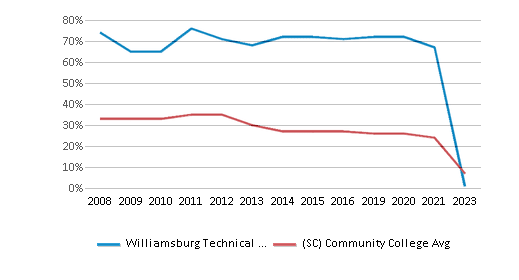
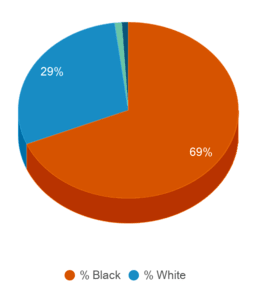
Minority enrollment is 71% of the student body (majority Black), which is more than the state average of 48%.
Quick Stats (2025)
- Enrollment: 943 students
- In-state tuition: $3,876
- Out-state tuition: $7,260
- Student:teacher ratio: 12:1
- Minority enrollment: 71%
- Source: Integrated Postsecondary Education Data System (IPEDS)
School Overview
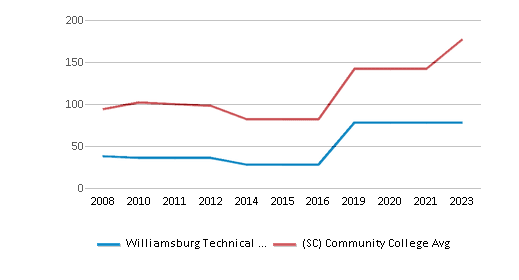
The teacher population of 78 teachers has stayed relatively flat over five years.
Williamsburg Technical College
(SC) Community College Avg.
Carnegie Classification
Associate's Colleges: High Career & Technical-High Nontraditional
Associate's Colleges: High Vocational & Technical-High Traditional
Institution Level
At least 2 but less than 4 years
At least 2 but less than 4 years
Institution Control
Public
Public
Total Faculty
78 staff
177 staff
School Calendar
Student Body
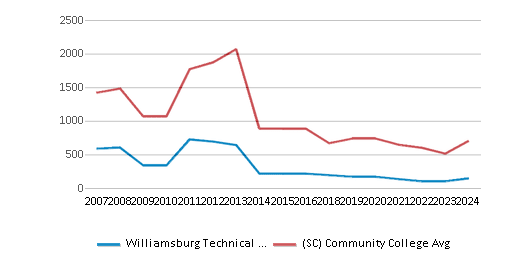
The student population of Williamsburg Technical College has grown by 13% over five years.
The student:teacher ratio of 12:1 has increased from 8:1 over five years.
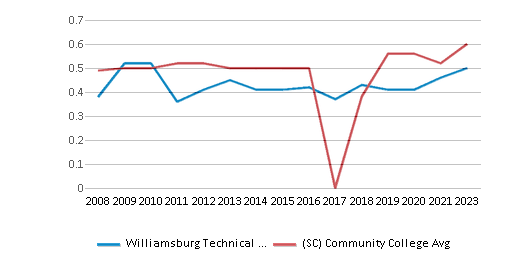
The Williamsburg Technical College diversity score of 0.45 is less than the state average of 0.63. The school's diversity has grown by 8% over five years.
Total Enrollment
943 students
2,253 students
Student : Teacher Ratio
12:1
18:1
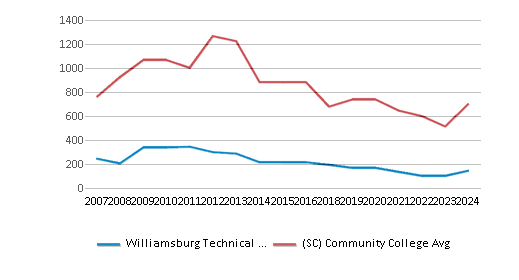
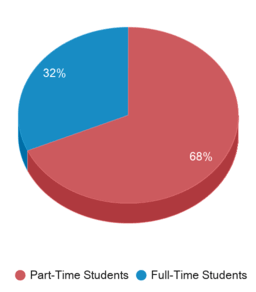
# Full-Time Students
146 students
622 students
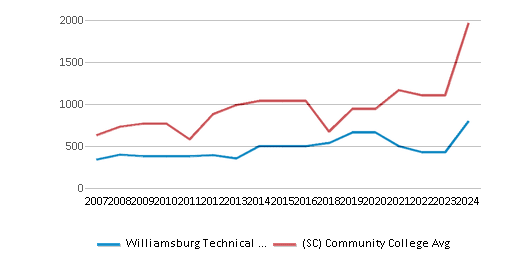
# Part-Time Students
797 students
1,349 students
# Enrollment Undergraduate
943 students
279 students
# Full-Time Undergraduate Students
146 students
605 students
# Full-Time Graduate Students
n/a
8 students
# Part-Time Undergraduate Students
797 students
1,965 students
# Part-Time Graduate Students
n/a
32 students
Total Dormitory Capacity
n/a
260 students
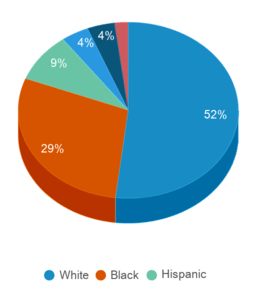
% American Indian/Alaskan
n/a
n/a
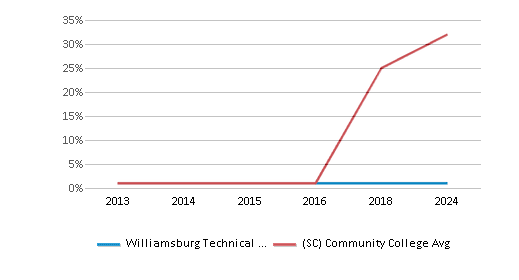
% Asian
n/a
2%
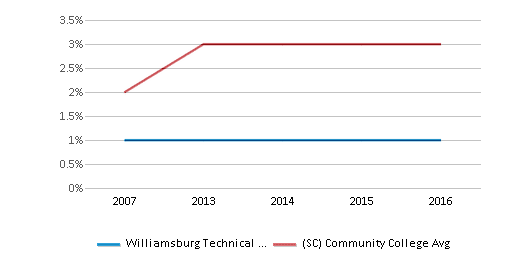
% Hispanic
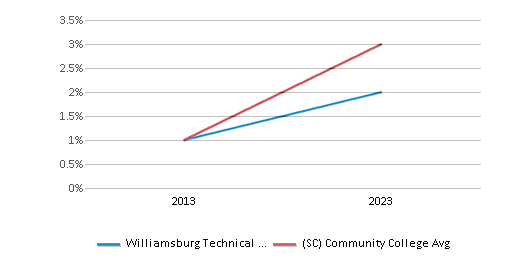
1%
9%
% Black
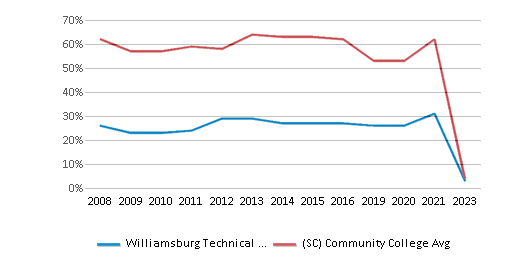
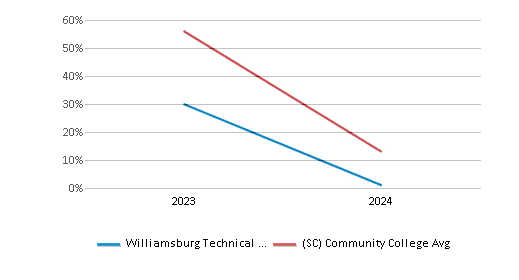
68%
29%
% White
29%
52%
% Hawaiian
n/a
n/a
% Two or more races
n/a
4%
% Unknown races
1%
4%
Diversity Score
0.45
0.63
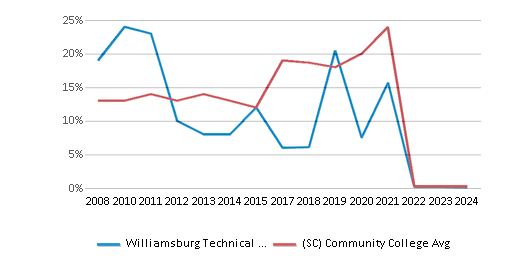
College Completion Rate (Students who graduate in less than 4 years)
0.1481%
0.2579%
College Completion Rate (Students who graduate in 4 years or more than 4 years)
n/a
0.172%
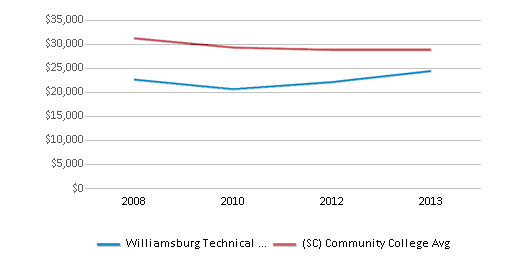
Average Graduate Earnings (10 Years)
$24,400
$28,800
Tuition and Acceptance Rate
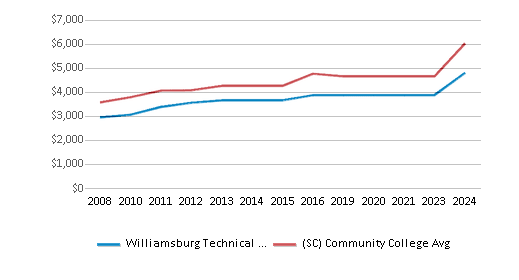
The public in-state tuition of $3,876 is less than the state average of $5,692. The in-state tuition has declined by 19% over four years.
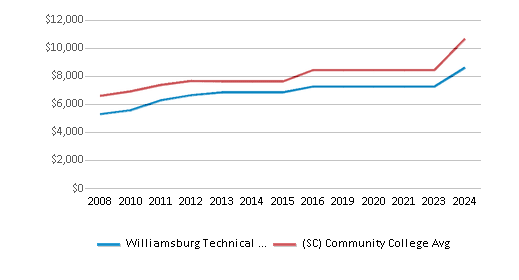
The public out-state tuition of $7,260 is less than the state average of $10,568. The out-state tuition has declined by 15% over four years.
In-State Tuition Fees
$3,876
$5,692
Out-State Tuition Fees
$7,260
$10,568
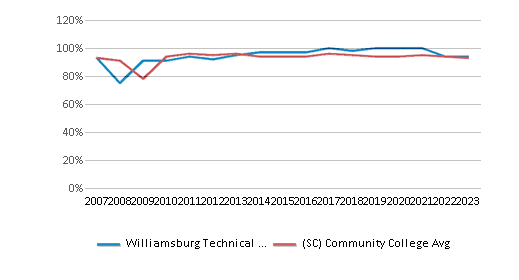
% Students Receiving Some Financial Aid
94%
93%
Median Debt for Graduates
n/a
$11,729
Median Debt for Dropouts
n/a
$5,500
Acceptance Rate
n/a
88%
SAT Reading
n/a
430
SAT Math
n/a
458
SAT Writing
n/a
413
ACT Composite
n/a
18
ACT English
n/a
17
ACT Math
n/a
18
ACT Writing
n/a
6
Source: 2024 (or latest year available) Integrated Postsecondary Education Data System (IPEDS)
School Notes
- Williamsburg Technical College opened its doors to students during late 1969, representing a new concept in comprehensive education coupled with various supportive services. For the first time in South Carolina, and most particularly Williamsburg County, all the following capabilities and services were available in one concentrated area: technical education, adult education, vocational education for high school students, continuing education for personal enrichment, and the offices of the state Job Service and Vocational Rehabilitation. Williamsburg Technical College is located in Kingstree, South Carolina. Located on 41 acres of land on Highway 377, Williamsburg Technical College is housed in six buildings: an administrative/learning building which contains classrooms, computer laboratories, an industrial laboratory, a physical science laboratory, an auditorium, a student lounge and administrative offices; a technology vocational building containing offices, technical laboratories and classrooms; a learning resources building which houses the Learning Resources Center, classrooms and offices of the Student Services Division; two special activities buildings, one housing temporary office space for welfare–to–work services and the other a greenhouse; and a Special Training Center/Storage Depot. The college offers, to residents of Williamsburg County with varying academic skill levels, the opportunity for postsecondary vocational, technical, and occupational programs leading directly to employment or maintenance of employment in any of the county's manufacturing firms, specializing in textiles, plastics, or metal fabrication. Additionally, Williamsburg Technical College offers postsecondary vocational programs leading directly to employment or maintenance of employment in many of the county's service industries to include cosmetology, nursing, and automotive repair. Associate degree programs are also offered which enable students to gain access through transfer to other postsecondary education. Williamsburg Technical College is accredited by the Commission on Colleges of the Southern Association of Colleges and Schools to award associate degrees.
Frequently Asked Questions
How much does Williamsburg Technical College cost?
Williamsburg Technical College's tuition is approximately $3,876 for In-State students and $7,260 for Out-State students.
Recent Articles

Obtaining Your Bachelor's Degree at a Community College
Explore the evolving landscape of community colleges offering bachelor's degrees, addressing affordability, accessibility, and workforce needs.

A to Z of Community College Certificates and Courses
From business and healthcare to technology and skilled trades, the article showcases the breadth of options available to students seeking to enhance their knowledge, develop new skills, or pursue career advancement.

What is a Community College?
This comprehensive guide explains what a community college is, its history, and its role in higher education. It covers the types of programs offered, differences from four-year colleges, benefits of attending, and important considerations for prospective students, providing valuable insights for those exploring educational options.

