Southeastern Illinois College

3575 College Road
Harrisburg, IL 62946
Top Ranked (2024-25): View Rankings
  • Southeastern Illinois College, as a comprehensive community college and a member of the Illinois Community College System of Higher Education, is committed to a philosophy that believes in the dignity and worth of each individual regardless of race, creed, gender, physical abilities, national or ethnic origin. As its mission, Southeastern strives to become the educational and cultural center of the community by providing for the development of intellectual, social, personal and productive skills to all persons who reside within Community College District #533.

School Highlights

Southeastern Illinois College serves 1,239 students (36% of students are full-time).
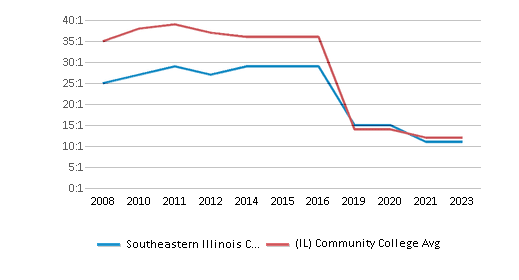
The college's student:teacher ratio of 11:1 is lower than the state community college average of 12:1.
Minority enrollment is 98% of the student body (majority Black and Asian), which is more than the state average of 96%.

Quick Stats (2024-25)

  • Enrollment: 1,239 students
  • In-state tuition: $4,530
  • Out-state tuition: $4,770
  • Student:teacher ratio: 11:1
  • Minority enrollment: 98%
  • Source: Integrated Postsecondary Education Data System (IPEDS)

Top Rankings

Southeastern Illinois College ranks among the top 20% of public schools in Illinois for:

Category
Attribute

School Overview

The teacher population of 113 teachers has stayed relatively flat over five years.
Southeastern Illinois College
(IL) Community College Avg.
Carnegie Classification
Associates Colleges
Associates Colleges
Institution Level
At least 2 but less than 4 years
Institution Control
Public
Public
Total Faculty
113 staff
227 staff
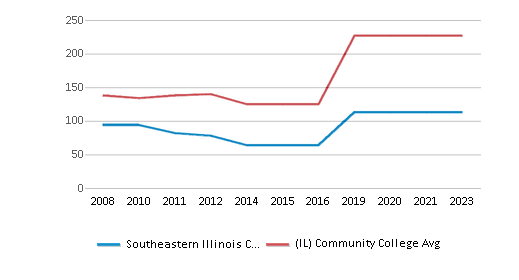
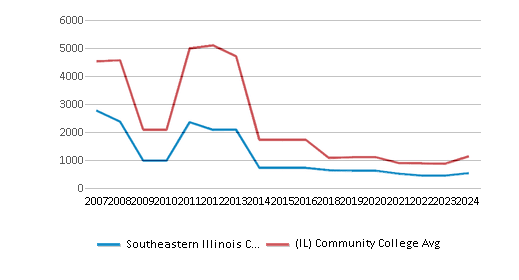
This chart displays total faculty of Southeastern Illinois College and community college average number of faculty in Illinois by year, with the latest 2022-23 school year data.

Student Body

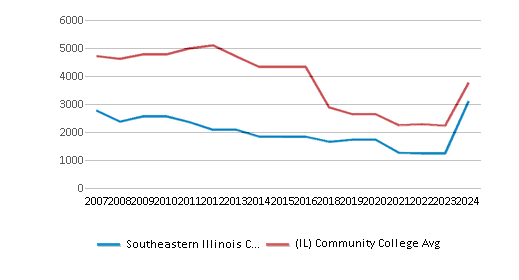
The student population of Southeastern Illinois College has declined by 28% over five years.
The student:teacher ratio of 11:1 has decreased from 15:1 over five years.
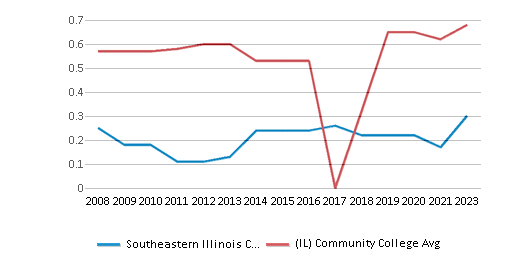
The Southeastern Illinois College diversity score of 0.30 is less than the state average of 0.69. The school's diversity has grown by 35% over five years.
Total Enrollment
1,239 students
2,558 students
This chart displays the total enrollment of Southeastern Illinois College and community college average number of enrollment of Illinois by year, with the latest 2022-23 school year data.
Student : Teacher Ratio
11:1
12:1
This chart displays the student staff ratio of Southeastern Illinois College and community college average student staff ratio of Illinois by year, with the latest 2022-23 school year data.
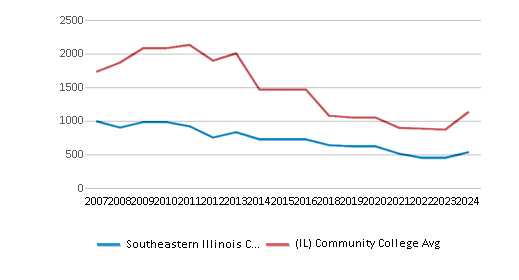
# Full-Time Students
450 students
872 students
This chart displays the total number of Full-time students enrollment of Southeastern Illinois College and average number of community college Full-time students enrollment of Illinois by year, with the latest 2022-23 school year data.
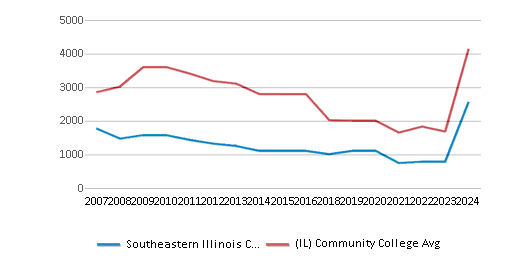
# Part-Time Students
789 students
1,686 students
This chart displays the total number of Part-time students enrollment of Southeastern Illinois College and average number of community college Part-time students enrollment of Illinois by year, with the latest 2022-23 school year data.
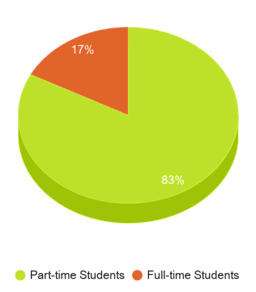
This chart displays the Full-time students and Part-time students enrollment breakdown of Southeastern Illinois College.
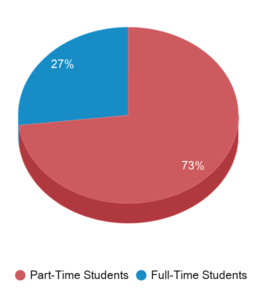
This chart displays community college average Full-Time students and Part-Time students enrollment breakdown of Illinois.
# Enrollment Undergraduate
984 students
40 students
# Full-Time Undergraduate Students
450 students
872 students
This chart displays the total number of Full-time undergraduate students enrollment of Southeastern Illinois College and average number of community college Full-time undergraduate  students enrollment of Illinois by year, with the latest 2022-23 school year data.
# Full-Time Graduate Students
n/a
43 students
# Part-Time Undergraduate Students
789 students
1,719 students
# Part-Time Graduate Students
n/a
16 students
Total Dormitory Capacity
n/a
132 students
% American Indian/Alaskan
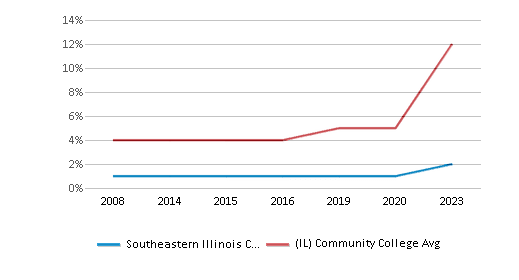
1%
5%
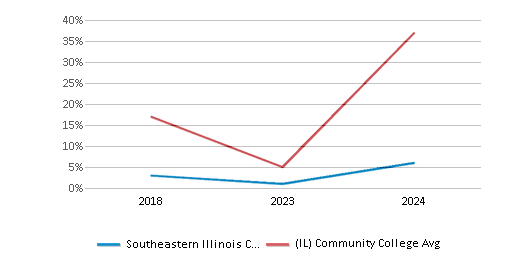
This chart displays the percentage of American Indian/Alaskan students in Southeastern Illinois College and the percentage of American Indian/Alaskan community college students in Illinois by year, with the latest 2022-23 school year data.
% Asian
2%
12%
This chart displays the percentage of Asian students in Southeastern Illinois College and the percentage of Asian community college students in Illinois by year, with the latest 2022-23 school year data.
% Hispanic
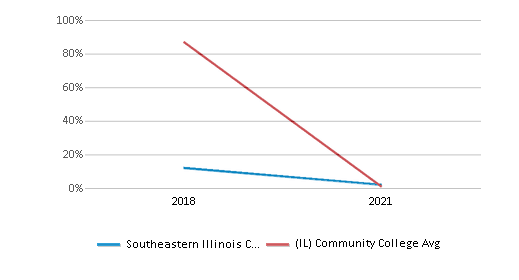
n/a
1%
This chart displays the percentage of Hispanic students in Southeastern Illinois College and the percentage of Hispanic community college students in Illinois by year, with the latest 2020-21 school year data.
% Black
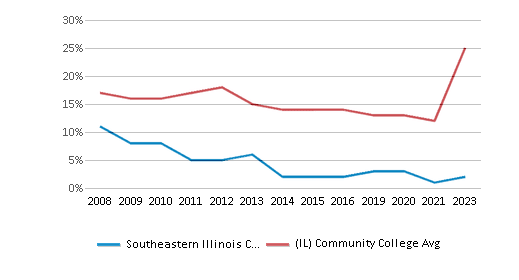
2%
25%
This chart displays the percentage of Black students in Southeastern Illinois College and the percentage of Black community college students in Illinois by year, with the latest 2022-23 school year data.
% White
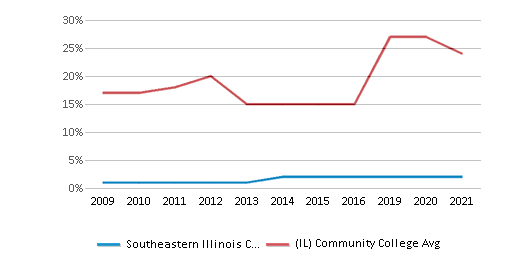
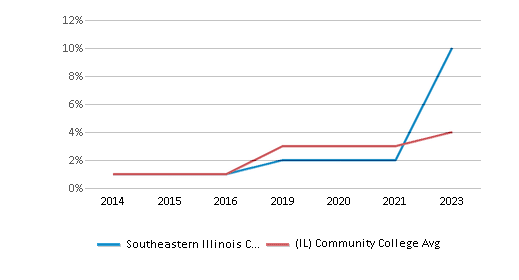
2%
4%
This chart displays the percentage of White students in Southeastern Illinois College and the percentage of White community college students in Illinois by year, with the latest 2022-23 school year data.
% Hawaiian
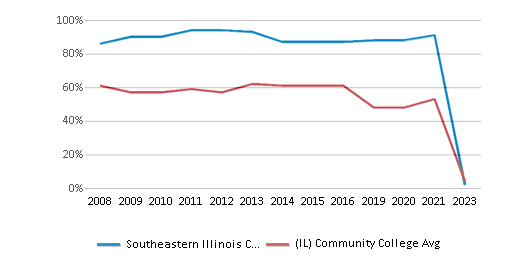
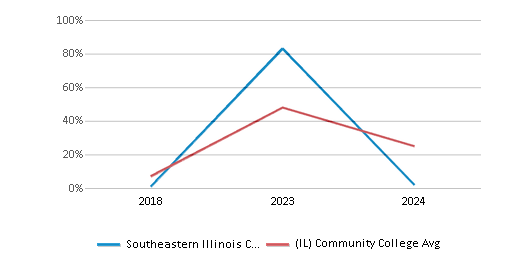
83%
48%
This chart displays the percentage of Hawaiian students in Southeastern Illinois College and the percentage of Hawaiian community college students in Illinois by year, with the latest 2022-23 school year data.
% Two or more races
10%
4%
This chart displays the percentage of Two or more races students in Southeastern Illinois College and the percentage of Two or more races community college students in Illinois by year, with the latest 2022-23 school year data.
% Non Resident races
n/a
n/a
This chart displays the percentage of Non Resident students in Southeastern Illinois College and the percentage of Non Resident community college students in Illinois by year, with the latest 2020-21 school year data.
% Unknown races
n/a
1%
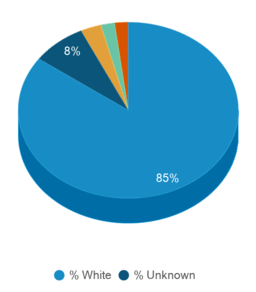
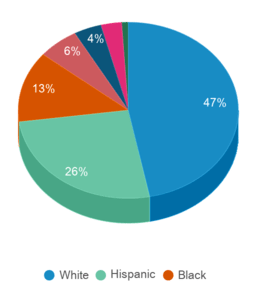
This chart displays the percentage breakdown of students of all ethnic groups in Southeastern Illinois College.
This chart displays the percentage breakdown of students of all ethnic groups in Illinois.
Diversity Score
0.30
0.69
This chart displays the diversity score of Southeastern Illinois College and the community college average diversity score of Illinois by year, with the latest 2022-23 school year data.
College Completion Rate (Students who graduate in less than 4 years)
0.3913%
0.3913%
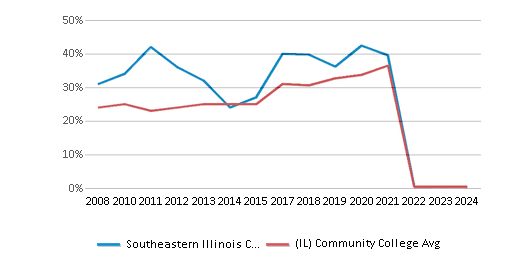
This chart displays completion rates for First-Time of Full-time students of Southeastern Illinois College and community college average completion rates for First-Time of Full-time students of Illinois by year, with the latest 2022-23 school year data.
College Completion Rate (Students who graduate in 4 years or more than 4 years)
n/a
0.6%
Average Graduate Earnings (10 Years)
$32,300
$31,800
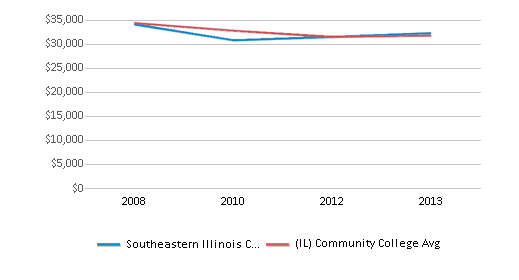
This chart displays average graduate earnings (10 Years) of Southeastern Illinois College and community college average graduate earnings (10 Years) of Illinois by year, disaggregated by student subgroups with the latest 2012-13 school year data.

Tuition and Acceptance Rate

The public in-state tuition of $4,530 is less than the state average of $7,875. The in-state tuition has declined by 23% over four years.
The public out-state tuition of $4,770 is less than the state average of $10,847. The out-state tuition has declined by 22% over four years.
In-State Tuition Fees
$4,530
$7,875
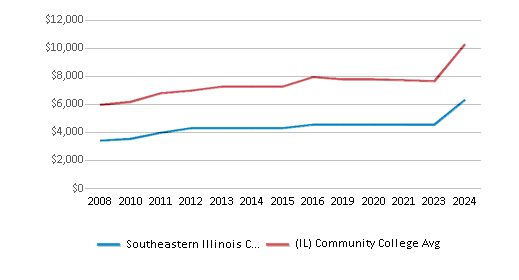
This chart displays tuition fees for an in-state student of Southeastern Illinois College and the public community college average tuition fees for an in-state student of Illinois by year, with the latest 2022-23 school year data.
Out-State Tuition Fees
$4,770
$10,847
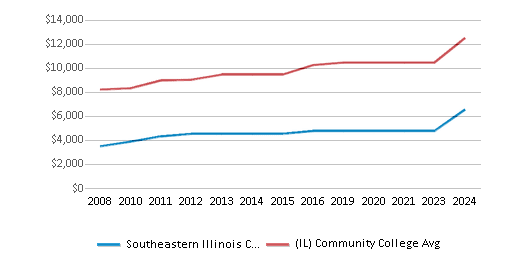
This chart displays tuition fees for an out-of-state student of Southeastern Illinois College and the public community college average tuition fees for an out-of-state student of Illinois by year, with the latest 2022-23 school year data.
% Students Receiving Some Financial Aid
75%
82%
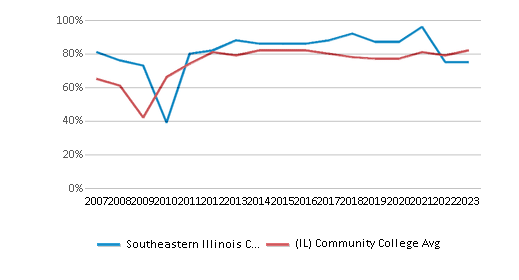
This chart displays the percent of students who is receiving some financial aid in Southeastern Illinois College and the percent of community college students who is receiving some financial aid in Illinois by year, with the latest 2022-23 school year data.
Median Debt for Graduates
n/a
$8,187
Median Debt for Dropouts
n/a
$4,618
Acceptance Rate
n/a
89%
SAT Reading
n/a
390
SAT Math
n/a
360
SAT Writing
n/a
355
ACT Composite
n/a
17
ACT English
n/a
17
ACT Math
n/a
17
Source: 2023 (or latest year available) Integrated Postsecondary Education Data System (IPEDS) , School Administrators

School Notes

  • Founded in 1960, the college has a 172-acre campus located at 3575 College Road, Harrisburg, Illinois. It serves the residents of Gallatin, Hardin, Pope and Saline Counties; portions of Hamilton, Johnson, Williamson and White Counties. Courses offered are: Arts and Science Associate Degree Programs, Associate in Applied Science Degree Programs, Associate in Engineering Science Degree, Associate in Liberal Studies Degree, Occupational Certificate Programs, (SIC operates educational programs at the White County Center, Vienna Correctional Center, Shawnee Correctional Center, Illinois Youth Center at Harrisburg, Hardin County Work Camp, and Dixon Springs Work Camp.) Southeastern Illinois College offers quality programs at one of the most affordable tuition rates in the region. We offer convenient courses - day, evening, on-line - to meet your busy schedule. Whether you take a single course or join us as a full-time student, your success starts at Southeastern. THe college is accreditated by the: Commission on Institutions of Higher Education of The North Central Association of Colleges and Schools.

Frequently Asked Questions

How much does Southeastern Illinois College cost?
Southeastern Illinois College's tuition is approximately $4,530 for In-State students and $4,770 for Out-State students.
What is Southeastern Illinois College's ranking?
Southeastern Illinois College ranks among the top 20% of community college in Illinois for: Least expensive tuition.

Recent Articles

The Problem with Community College Placement Tests
This article examines the issues surrounding community college placement tests, highlighting their potential inaccuracy and negative impact on student success. It discusses alternative assessment methods, such as using high school grades, and explores ways to improve the placement process to better support students' academic progress.
7 Problems with Community Colleges And What Can be Done about Them
This article identifies seven key challenges facing community colleges, including low completion rates, underprepared students, and skills gaps. It also proposes solutions to address these issues, such as redefining institutional missions, improving collaboration between schools, and enhancing community support to improve the overall quality of education.
What to Expect Your First Semester of Community College
This article provides valuable insights for new community college students, covering topics such as choosing appropriate classes, academic preparation, balancing work and school commitments, and managing social activities. It offers practical advice to help students navigate their first semester successfully and set the foundation for their academic journey.

Quick Stats (2024-25)

  • Enrollment: 1,239 students
  • In-state tuition: $4,530
  • Out-state tuition: $4,770
  • Student:teacher ratio: 11:1
  • Minority enrollment: 98%
  • Source: Integrated Postsecondary Education Data System (IPEDS)

Related School Videos

Did You Know?

For Illinois public community colleges, the average tuition is approximately $7,875 per year for in-state students and $10,847 for out-of-state students. For private community colleges, the average yearly tuition is approximately $14,511 per year. Read more about average community college tuition costs across the country.

The average community college acceptance rate in Illinois is 87%. Read more about national community college acceptance rates.

Illinois community colleges have a diversity score of 0.69, which is lower than the national average of 0.75. The most diverse community college in Illinois is Toyota Technological Institute at Chicago. Read more about community college diversity statistics in the USA.

Quick Links