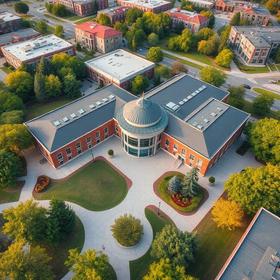
Ohio State University-Mansfield Campus

  • The Mansfield campus of The Ohio State University was created through a partnership between Mansfield area citizens and the state of Ohio. Faculty at The Ohio State University at Mansfield are highly involved with research, scholarship, and the creation of new knowledge. You can play an important role in this research by providing assistance to faculty members in a variety of fields. Through its Mansfield Campus, The Ohio State University extends Ohio State University courses, curricula and resources geographically, to meet the educational needs of the people of North Central Ohio. At Ohio State, we celebrate and learn from our diversity and we value individual differences. Academic freedom is defended within an environment of civility, tolerance, and mutual respect.

School Highlights

Ohio State University-Mansfield Campus serves 1,099 students (65% of students are full-time).
The college's student:teacher ratio of 10:1 is lower than the state community college average of 23:1.
Minority enrollment is 32% of the student body (majority Black), which is less than the state average of 38%.

Quick Stats (2025)

  • Enrollment: 1,099 students
  • In-state tuition: $7,140
  • Out-state tuition: $23,640
  • Student:teacher ratio: 10:1
  • Minority enrollment: 32%
  • Source: Integrated Postsecondary Education Data System (IPEDS)

School Overview

The teacher population of 105 teachers has stayed relatively flat over five years.
Ohio State University-Mansfield Campus
(OH) Community College Avg.
Carnegie Classification
Baccalaureate/Associate's Colleges: Mixed Baccalaureate/Associate's
Institution Level
Less than 2 yrs
At least 2 but less than 4 years
Institution Control
Public
Private not-for-profit
Total Faculty
105 staff
93 staff
This chart displays total faculty of Ohio State University-Mansfield Campus and community college average number of faculty in Ohio by year, with the latest 2022-23 school year data.

Student Body

The student population of Ohio State University-Mansfield Campus has stayed relatively flat over five years.
The student:teacher ratio of 10:1 has stayed the same over five years.
The Ohio State University-Mansfield Campus diversity score of 0.52 is less than the state average of 0.58. The school's diversity has grown by 49% over five years.
Total Enrollment
1,099 students
533 students
This chart displays the total enrollment of Ohio State University-Mansfield Campus and community college average number of enrollment of Ohio by year, with the latest 2023-24 school year data.
Student : Teacher Ratio
10:1
23:1
This chart displays the student staff ratio of Ohio State University-Mansfield Campus and community college average student staff ratio of Ohio by year, with the latest 2022-23 school year data.
# Full-Time Students
714 students
397 students
This chart displays the total number of Full-time students enrollment of Ohio State University-Mansfield Campus and average number of community college Full-time students enrollment of Ohio by year, with the latest 2023-24 school year data.
# Part-Time Students
385 students
360 students
This chart displays the total number of Part-time students enrollment of Ohio State University-Mansfield Campus and average number of community college Part-time students enrollment of Ohio by year, with the latest 2023-24 school year data.
This chart displays the Full-time students and Part-time students enrollment breakdown of Ohio State University-Mansfield Campus.
This chart displays community college average Full-Time students and Part-Time students enrollment breakdown of Ohio.
# Enrollment Undergraduate
109 students
308 students
# Full-Time Undergraduate Students
714 students
385 students
This chart displays the total number of Full-time undergraduate students enrollment of Ohio State University-Mansfield Campus and average number of community college Full-time undergraduate  students enrollment of Ohio by year, with the latest 2023-24 school year data.
# Full-Time Graduate Students
8 students
10 students
This chart displays the total number of Full-time graduate students enrollment of Ohio State University-Mansfield Campus and average number of community college Full-time graduate students enrollment of Ohio by year, with the latest 2022-23 school year data.
This chart displays graduation rate breakdown of Ohio State University-Mansfield Campus
Ohio All Graduation Breakdown
# Part-Time Undergraduate Students
n/a
380 students
# Part-Time Graduate Students
n/a
3 students
Total Dormitory Capacity
n/a
425 students
This chart displays the dormitory capacity of Ohio State University-Mansfield Campus and the community college average dormitory capacity of Ohio by year, with the latest 2020-21 school year data.
% American Indian/Alaskan
n/a
n/a
This chart displays the percentage of American Indian/Alaskan students in Ohio State University-Mansfield Campus and the percentage of American Indian/Alaskan community college students in Ohio by year, with the latest 2022-23 school year data.
% Asian
3%
4%
This chart displays the percentage of Asian students in Ohio State University-Mansfield Campus and the percentage of Asian community college students in Ohio by year, with the latest 2022-23 school year data.
% Hispanic
5%
6%
This chart displays the percentage of Hispanic students in Ohio State University-Mansfield Campus and the percentage of Hispanic community college students in Ohio by year, with the latest 2020-21 school year data.
% Black
10%
15%
This chart displays the percentage of Black students in Ohio State University-Mansfield Campus and the percentage of Black community college students in Ohio by year, with the latest 2022-23 school year data.
% White
68%
62%
This chart displays the percentage of White students in Ohio State University-Mansfield Campus and the percentage of White community college students in Ohio by year, with the latest 2022-23 school year data.
% Hawaiian
6%
2%
% Two or more races
4%
4%
This chart displays the percentage of Two or more races students in Ohio State University-Mansfield Campus and the percentage of Two or more races community college students in Ohio by year, with the latest 2022-23 school year data.
% Non Resident races
n/a
1%
% Unknown races
2%
6%
This chart displays the percentage breakdown of students of all ethnic groups in Ohio State University-Mansfield Campus.
This chart displays the percentage breakdown of students of all ethnic groups in Ohio.
Diversity Score
0.52
0.58
This chart displays the diversity score of Ohio State University-Mansfield Campus and the community college average diversity score of Ohio by year, with the latest 2022-23 school year data.
College Completion Rate (Students who graduate in less than 4 years)
n/a
0.5417%
College Completion Rate (Students who graduate in 4 years or more than 4 years)
0.1636%
0.2197%
Average Graduate Earnings (10 Years)
$48,900
$31,900
This chart displays average graduate earnings (10 Years) of Ohio State University-Mansfield Campus and community college average graduate earnings (10 Years) of Ohio by year, disaggregated by student subgroups with the latest 2012-13 school year data.

Tuition and Acceptance Rate

The public in-state tuition of $7,140 is more than the state average of $5,023. The in-state tuition has declined by 13% over four years.
The public out-state tuition of $23,640 is more than the state average of $10,825. The out-state tuition has declined by 21% over four years.
In-State Tuition Fees
$7,140
$5,023
This chart displays tuition fees for an in-state student of Ohio State University-Mansfield Campus and the public community college average tuition fees for an in-state student of Ohio by year, with the latest 2023-24 school year data.
Out-State Tuition Fees
$23,640
$10,825
This chart displays tuition fees for an out-of-state student of Ohio State University-Mansfield Campus and the public community college average tuition fees for an out-of-state student of Ohio by year, with the latest 2023-24 school year data.
% Students Receiving Some Financial Aid
79%
88%
This chart displays the percent of students who is receiving some financial aid in Ohio State University-Mansfield Campus and the percent of community college students who is receiving some financial aid in Ohio by year, with the latest 2022-23 school year data.
Median Debt for Graduates
$20,500
$18,500
This chart displays median debt for students who have completed a certificate or degree in Ohio State University-Mansfield Campus and average median debt for community college students who have completed a certificate or degree in Ohio by year, with the latest 2022-23 school year data.
Median Debt for Dropouts
$6,500
$6,500
This chart displays median debt for students who have not completed a certificate or degree in Ohio State University-Mansfield Campus and average median debt for community college students who have not completed a certificate or degree in Ohio by year, with the latest 2022-23 school year data.
Acceptance Rate
n/a
73%
SAT Reading
n/a
460
SAT Math
n/a
475
SAT Writing
n/a
465
ACT Composite
n/a
21
ACT English
n/a
20
ACT Math
n/a
20
Source: 2024 (or latest year available) Integrated Postsecondary Education Data System (IPEDS)

Frequently Asked Questions

How much does Ohio State University-Mansfield Campus cost?
Ohio State University-Mansfield Campus's tuition is approximately $7,140 for In-State students and $23,640 for Out-State students.

Recent Articles

Careers: Broadcasting
Take advantage of career opportunities in the field of radio broadcasting by starting your training at your local community college.
Unlocking Airport Career Opportunities: Your Guide to Ground Jobs
Discover the diverse range of ground jobs at mid-size U.S. airports, their educational requirements, and how community colleges can prepare you for these exciting careers.
Adult Learners: Upgrading Your Skills
We offer straightforward advice on identifying transferable skills, exploring job opportunities, leveraging community resources, and embracing lifelong learning. With relatable examples and encouragement, this guide aims to empower readers to navigate the job market confidently and successfully transition into new careers.

Quick Stats (2025)

  • Enrollment: 1,099 students
  • In-state tuition: $7,140
  • Out-state tuition: $23,640
  • Student:teacher ratio: 10:1
  • Minority enrollment: 32%
  • Source: Integrated Postsecondary Education Data System (IPEDS)

Related School Videos

Did You Know?

For Ohio public community colleges, the average tuition is approximately $5,023 per year for in-state students and $10,825 for out-of-state students. For private community colleges, the average yearly tuition is approximately $13,816 per year. Read more about average community college tuition costs across the country.

The average community college acceptance rate in Ohio is 74%. Read more about national community college acceptance rates.

Ohio community colleges have a diversity score of 0.58, which is higher than the national average of 0.00. The most diverse community college in Ohio is Ross College-Canton. Read more about community college diversity statistics in the USA.

Quick Links