- Middle Georgia College was a four-year state college unit of the University System of Georgia, United States. On January 8, 2013, it was consolidated with Macon State College into a new institution, which is now known as Middle Georgia State University.
School Highlights
Middle Georgia College serves 3,496 students (71% of students are full-time).
The college's student-teacher ratio of 17:1 is lower than the state community college average of 18:1.
Minority enrollment is 46% of the student body (majority Black), which is less than the state average of 61%.
Quick Facts (2026)
- Enrollment: 3,496 students
- Acceptance Rate: 80%
- Student-teacher ratio: 17:1
- Minority enrollment: 46%
- Source: Integrated Postsecondary Education Data System (IPEDS)
School Overview
The teacher population of 206 teachers has stayed relatively flat over five years.
Middle Georgia College
(GA) Community College Avg.
Carnegie Classification
Associates Colleges
Associates--Public Rural-serving Medium
Institution Level
Less than 2 yrs
At least 2 but less than 4 years
Institution Control
Public
Public
Total Faculty
206 staff
209 staff
School Calendar
Student Body
The student population of Middle Georgia College has stayed relatively flat over five years.
The student-teacher ratio of 17:1 has stayed the same over five years.
The Middle Georgia College diversity score of 0.54 is less than the state average of 0.71. The school's diversity has stayed relatively flat over five years.
Total Enrollment
3,496 students
2,604 students
Student-Teacher Ratio
17:1
18:1
# Full-Time Students
2,471 students
882 students
# Part-Time Students
1,025 students
1,722 students
# Enrollment Undergraduate
n/a
299 students
# Full-Time Undergraduate Students
3,496 students
929 students
# Full-Time Graduate Students
n/a
87 students
# Part-Time Undergraduate Students
n/a
1,848 students
# Part-Time Graduate Students
n/a
53 students
Total Dormitory Capacity
n/a
654 students
% Asian
1%
4%
% Hispanic
2%
10%
% Black
41%
35%
% White
54%
39%
% Hawaiian
1%
1%
% Two or more races
1%
3%
% Non Resident races
n/a
1%
% Unknown races
n/a
7%
Diversity Score
0.54
0.71
College Completion Rate (Students who graduate in less than 4 years) (Year 2007)
17%
29%
College Completion Rate (Students who graduate in 4 years or more than 4 years)
n/a
24%
Average Graduate Earnings (10 Years)
$35,200
$29,500
Tuition and Acceptance Rate
% Students Receiving Some Financial Aid
85%
94%
Median Debt for Graduates
$11,855
$9,775
Median Debt for Dropouts
$6,833
$4,490
Acceptance Rate
80%
75%
SAT Reading
n/a
465
SAT Math
n/a
450
SAT Writing
n/a
465
ACT Composite
n/a
18
ACT English
n/a
18
ACT Math
n/a
18
ACT Writing
n/a
7
Source: 2023 (or latest year available) Integrated Postsecondary Education Data System (IPEDS) , School Administrators
School Notes
- School Mascot: Knights
- Middle Georgia College (MGC) is a state college unit of the University System of Georgia with a focus on providing constituents access to certificate, associate, and select baccalaureate programs in academic transfer or occupation related programs of study. The College is dedicated to providing a dynamic, learning-centered, caring and technically advanced environment of excellence. As a multi-campus, residential institution, the College pursues innovative opportunities to provide services to its traditional and non-traditional students primarily from rural areas of south central Georgia and will maintain a recognized legacy of affordable higher education and community support services of the highest quality. The College also serves as the only higher education institution of aviation for the State of Georgia. The College's historic main campus in Cochran offers academic programs of study through the baccalaureate degree for commuting and residential students. The Institution's Georgia Aviation campus in Eastman provides aviation specific technical education for the State while supporting the main campus' Bachelor of Science in Aviation Management degree program. The Dublin Campus provides educational opportunities for central Georgia commuting students. Selected certificate and associate degree programs, as well as additional advanced higher education opportunities, are offered online and in collaboration with participating four-year institutions. In addition, MGC provides undergraduate education addressing the economic development needs of Georgia's heartland and the state's aviation industry.
Frequently Asked Questions
What is the acceptance rate of Middle Georgia College?
The acceptance rate of Middle Georgia College is 80%, which is higher than the state average of 75%.
Recent Articles

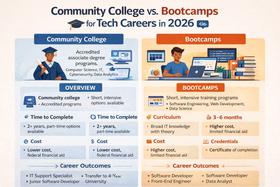
Community College vs. Bootcamps for Tech Careers in 2026
Community college vs. bootcamps in 2026. Compare cost, outcomes, credentials, and hiring trends to choose the best tech career path.

How to Build a Class Schedule That Fits Your Life (Spring 2026)
Learn how to build a class schedule that fits your life with expert tips, updated strategies for Spring 2026, and practical planning tools for students and families.

Top 10 Jobs for Community College Graduates in 2026
Meta Description: Discover high-demand jobs for community college graduates, with current salary trends, costs, and career pathways.


