School Highlights
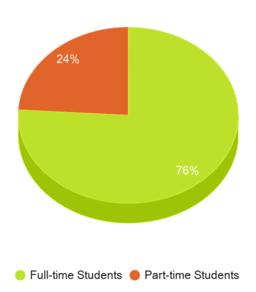
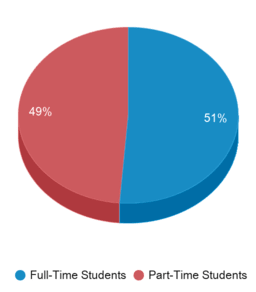
Lindsey Hopkins Technical College serves 458 students (76% of students are full-time).
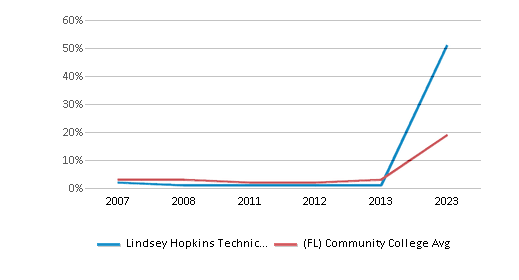
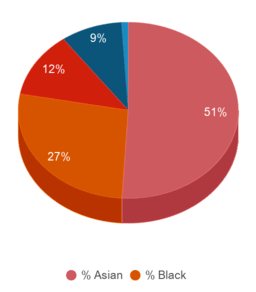
Minority enrollment is 99% of the student body (majority Asian), which is more than the state average of 67%.
Quick Stats (2025)
- Enrollment: 458 students
- Minority enrollment: 99%
- Source: Integrated Postsecondary Education Data System (IPEDS)
Top Rankings
Lindsey Hopkins Technical College ranks among the top 20% of public schools in Florida for:
Category
Attribute
School Overview
Lindsey Hopkins Technical College
(FL) Community College Avg.
Carnegie Classification
Not applicable, not in Carnegie universe (not accredited or nondegree-granting)
Not applicable, not in Carnegie universe (not accredited or nondegree-granting)
Institution Level
At least 2 but less than 4 years
At least 2 but less than 4 years
Institution Control
Public
Private not-for-profit
Total Faculty
n/a
139 staff
Student Body
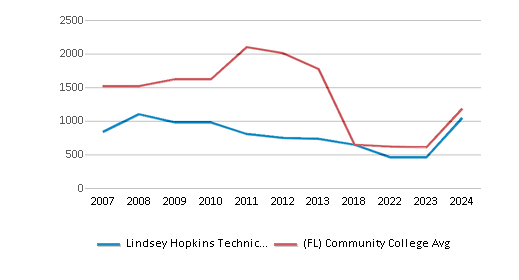
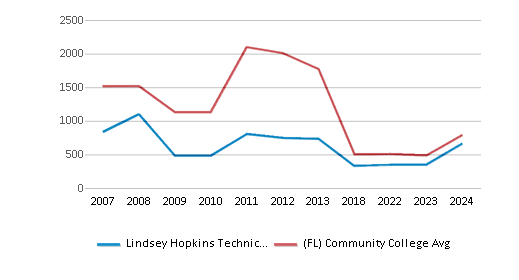
The student population of Lindsey Hopkins Technical College has declined by 38% over five years.
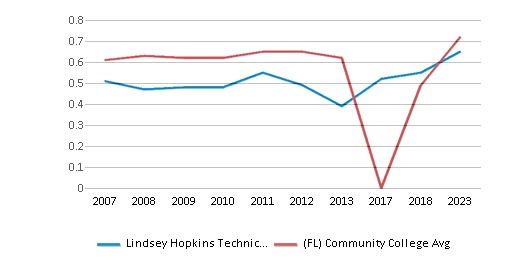
The Lindsey Hopkins Technical College diversity score of 0.65 is less than the state average of 0.76. The school's diversity has grown by 66% over five years.
Total Enrollment
458 students
646 students
Student : Teacher Ratio
n/a
20:1
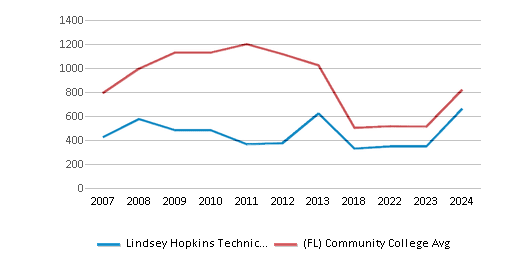
# Full-Time Students
348 students
587 students
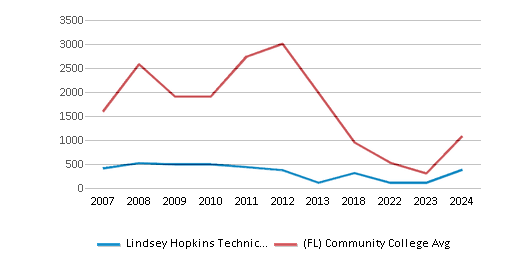
# Part-Time Students
110 students
557 students
# Enrollment Undergraduate
n/a
261 students
# Full-Time Undergraduate Students
348 students
574 students
# Full-Time Graduate Students
n/a
85 students
# Part-Time Undergraduate Students
110 students
648 students
# Part-Time Graduate Students
n/a
36 students
Total Dormitory Capacity
n/a
174 students
% American Indian/Alaskan
n/a
n/a
% Asian
51%
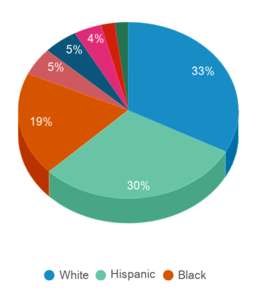
5%
% Hispanic
n/a
30%
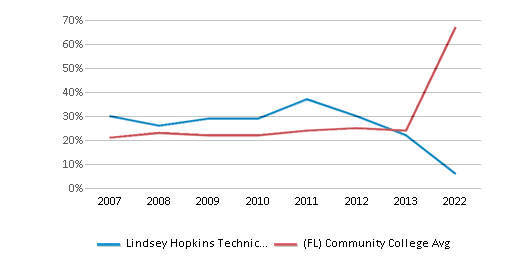
% Black
27%
19%
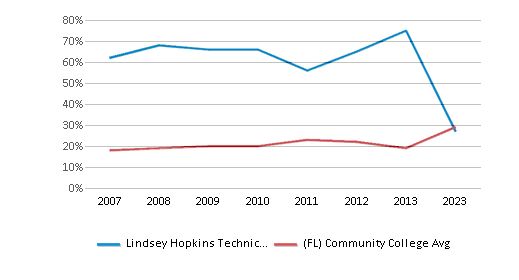
% White
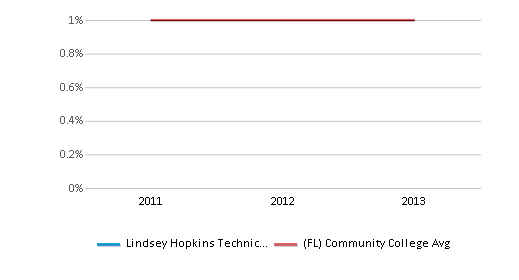
1%
33%
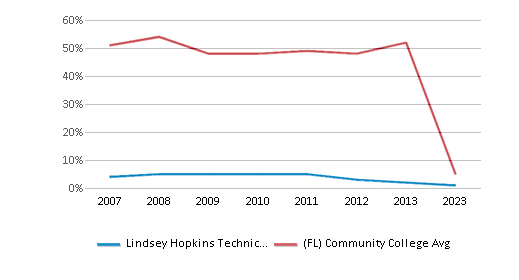
% Hawaiian
12%
2%
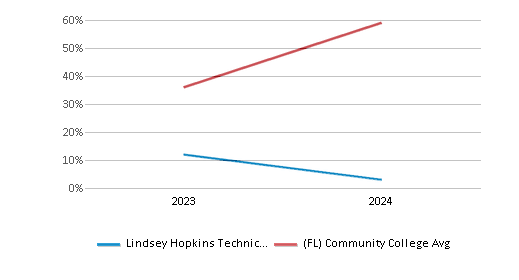
% Two or more races
n/a
4%
% Non Resident races
n/a
2%
% Unknown races
9%
5%
Diversity Score
0.65
0.76
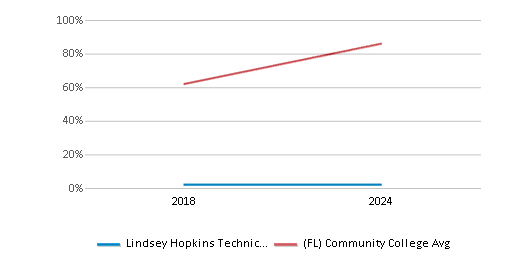
College Completion Rate (Students who graduate in less than 4 years)
0.3043%
0.6183%
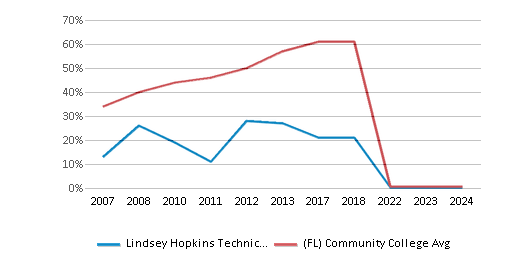
College Completion Rate (Students who graduate in 4 years or more than 4 years)
n/a
0.4334%
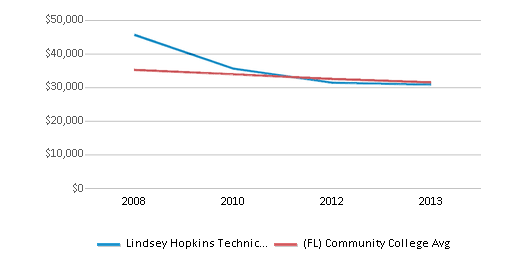
Average Graduate Earnings (10 Years)
$30,800
$31,500
Tuition and Acceptance Rate
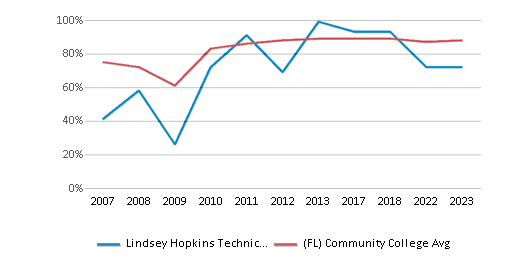
% Students Receiving Some Financial Aid
72%
88%
Median Debt for Graduates
n/a
$9,750
Median Debt for Dropouts
n/a
$5,500
Acceptance Rate
n/a
94%
SAT Reading
n/a
442
SAT Math
n/a
429
ACT Composite
n/a
18
ACT English
n/a
18
ACT Math
n/a
18
Source: 2024 (or latest year available) Integrated Postsecondary Education Data System (IPEDS)
Profile last updated: 08/14/2024
Frequently Asked Questions
What is Lindsey Hopkins Technical College's ranking?
Lindsey Hopkins Technical College ranks among the top 20% of community college in Florida for: Average community college minority breakdown.
Recent Articles

Obtaining Your Bachelor's Degree at a Community College
Explore the evolving landscape of community colleges offering bachelor's degrees, addressing affordability, accessibility, and workforce needs.

A to Z of Community College Certificates and Courses
From business and healthcare to technology and skilled trades, the article showcases the breadth of options available to students seeking to enhance their knowledge, develop new skills, or pursue career advancement.

What is a Community College?
This comprehensive guide explains what a community college is, its history, and its role in higher education. It covers the types of programs offered, differences from four-year colleges, benefits of attending, and important considerations for prospective students, providing valuable insights for those exploring educational options.


