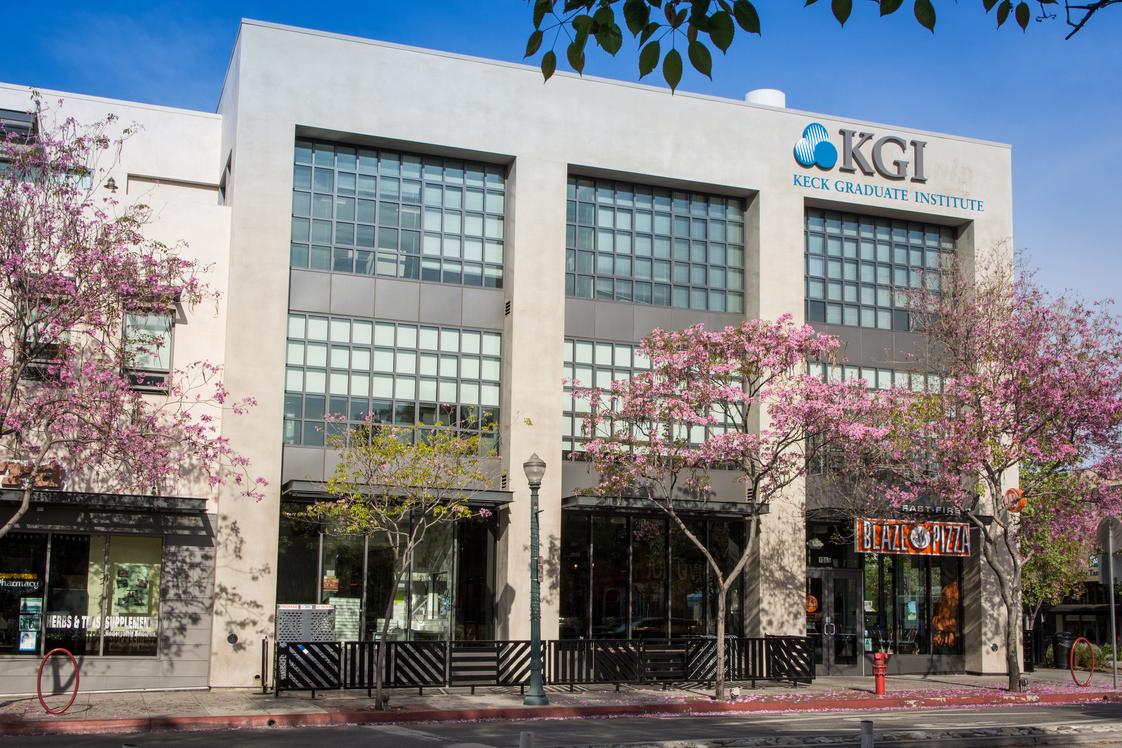
- Founded in 1997, Keck Graduate Institute is the only American graduate institution devoted solely to bioscience education and discovery. KGI is the seventh and newest member of the Claremont Colleges consortium.
School Highlights
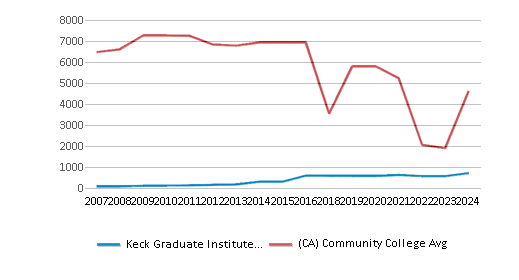
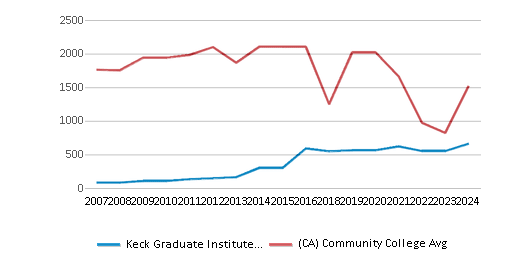
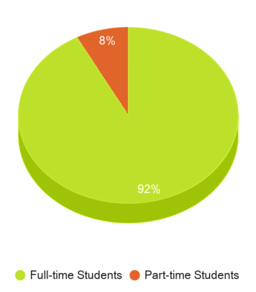
Keck Graduate Institute serves 716 students (92% of students are full-time).
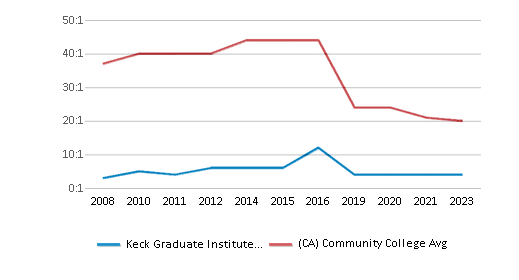
The college's student:teacher ratio of 4:1 is lower than the state community college average of 32:1.
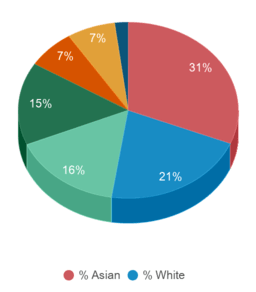
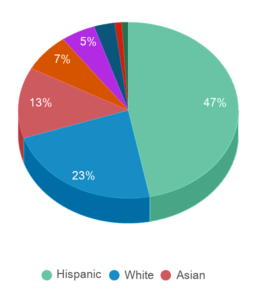
Minority enrollment is 79% of the student body (majority Asian), which is more than the state average of 77%.
Quick Stats (2025)
- Enrollment: 716 students
- Student:teacher ratio: 4:1
- Minority enrollment: 79%
- Source: Integrated Postsecondary Education Data System (IPEDS)
Top Rankings
Keck Graduate Institute ranks among the top 20% of public schools in California for:
Category
Attribute
Diversity
School Overview
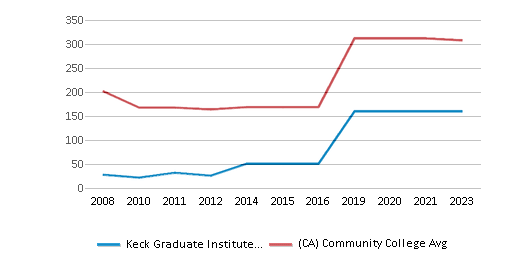
The teacher population of 160 teachers has stayed relatively flat over five years.
Keck Graduate Institute
(CA) Community College Avg.
Carnegie Classification
Master's Colleges & Universities: Larger Programs
Baccalaureate/Associate's Colleges: Associate's Dominant
Institution Level
Four or more years
At least 2 but less than 4 years
Institution Control
Private not-for-profit
Public
Total Faculty
160 staff
294 staff
School Calendar
Student Body
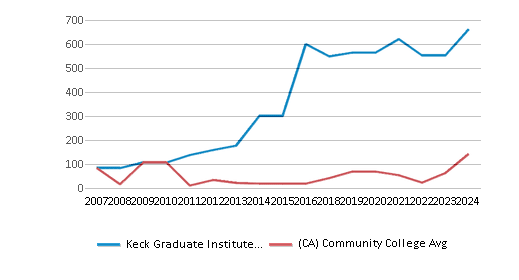
The student population of Keck Graduate Institute has grown by 23% over five years.
The student:teacher ratio of 4:1 has stayed the same over five years.
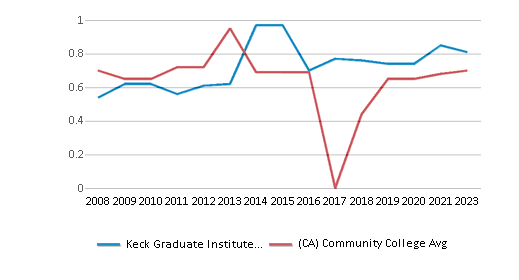
The Keck Graduate Institute diversity score of 0.82 is more than the state average of 0.70. The school's diversity has grown by 11% over five years.
Total Enrollment
716 students
2,311 students
Student : Teacher Ratio
4:1
32:1
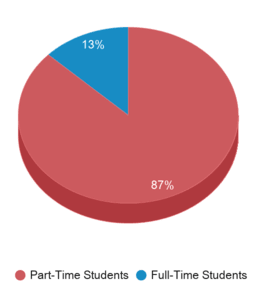
# Full-Time Students
661 students
1,232 students
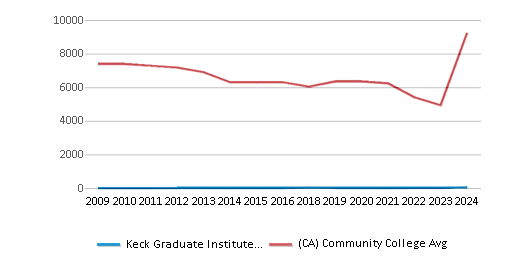
# Part-Time Students
55 students
8,299 students
# Enrollment Undergraduate
n/a
240 students
# Full-Time Undergraduate Students
n/a
1,155 students
# Full-Time Graduate Students
661 students
63 students
# Part-Time Undergraduate Students
n/a
8,457 students
# Part-Time Graduate Students
55 students
10 students
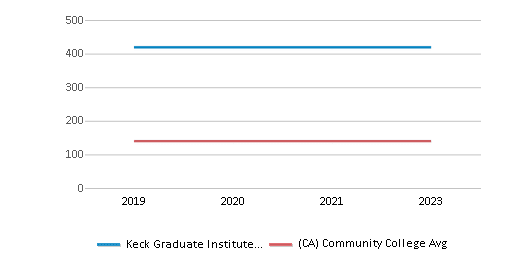
Total Dormitory Capacity
419 students
140 students
% American Indian/Alaskan
n/a
n/a
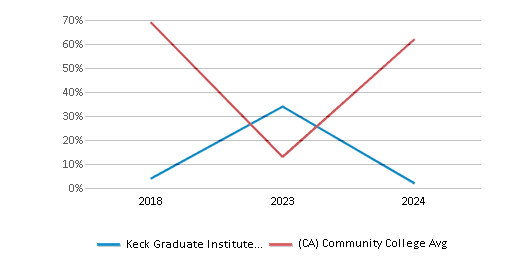
% Asian
31%
13%
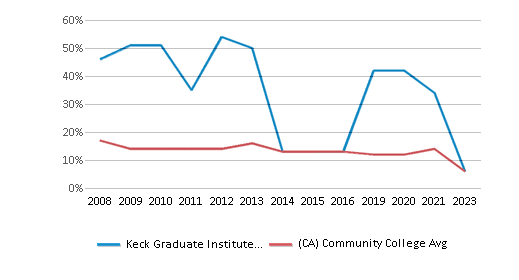
% Hispanic
16%
47%
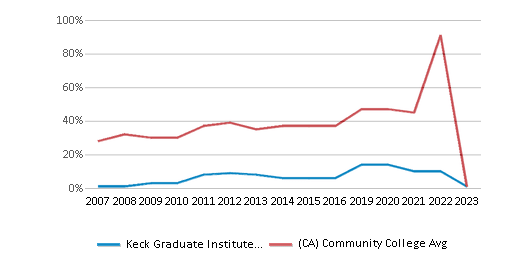
% Black
7%
7%
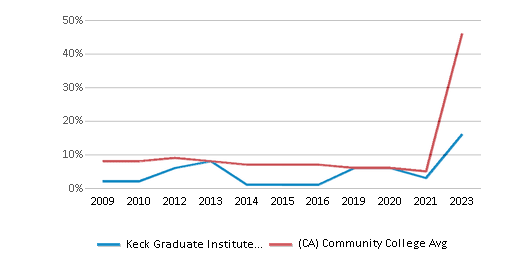
% White
21%
23%
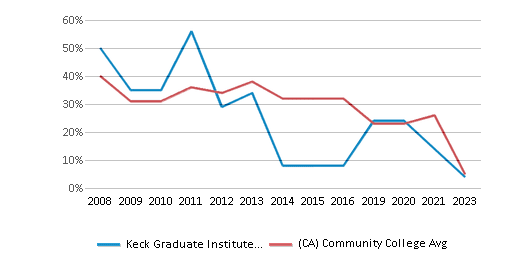
% Hawaiian
n/a
1%
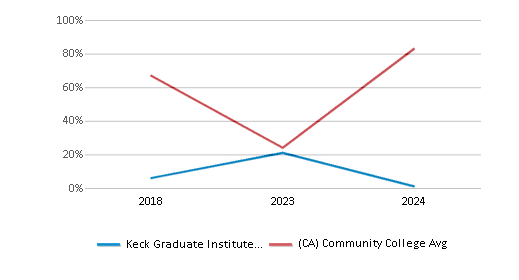
% Two or more races
7%
5%
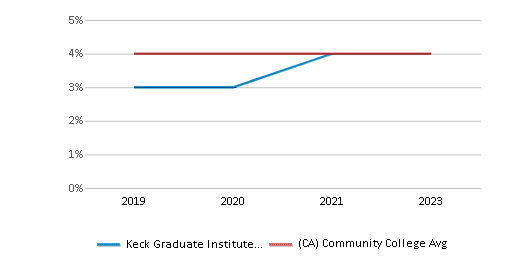
% Non Resident races
15%
1%
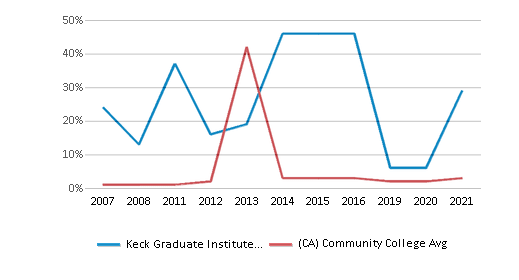
% Unknown races
2%
3%
Diversity Score
0.82
0.70
College Completion Rate (Students who graduate in less than 4 years)
n/a
0.4221%
College Completion Rate (Students who graduate in 4 years or more than 4 years)
n/a
0.4304%
Tuition and Acceptance Rate
% Students Receiving Some Financial Aid
n/a
85%
Median Debt for Graduates
n/a
$10,500
Median Debt for Dropouts
n/a
$6,239
Acceptance Rate
n/a
92%
Source: 2024 (or latest year available) Integrated Postsecondary Education Data System (IPEDS)
School Notes
Today the most exciting work in the life sciences,
engineering, and managementis happening in the biosciences
industry. To translate new discoveries into applications
that improve the human condition, industry demands a new kind of
professional - scientifically proficient and managerially
savvy.
Keck Graduate Institute (KGI)has responded to this challenge with a pioneering class of graduate degrees and programs to educate those individuals who want to shape the future of the life sciences.
Established to prepare the future generation of industry leaders, KGI breaks down and transforms traditional boundariesbetween the academic and corporate worlds. Our degree and research programs are singularly focused on the unique and specific demands of the biosciences industry, drawing widely on the guidance of a world-class advisory council that includes leaders in industry, science, and higher education.
Recognizing that the solution of practical, real-world challenges requires close teamwork, creative problem-solving skills, and cross-functional fluency, our curriculum is fundamentally interdisciplinary, incorporating an intensive technical component and a broad management and policy component, as well as innovative approaches to developing leadership skills. As a result, our students graduate with a practical understanding of the results-oriented, collaborative culture in which scientists, engineers, and managers operate.
KGI Academic Programs:
- Master of Business and Science(MBS):Designed to educate those who want to lead the way in the biotechnology, pharmaceutical, healthcare product and bioagricultural industries.
- Master of Engineering (MEng) in Biopharmaceutical Processing: The two-year program is designed for high potential individuals seeking a career in biopharmaceutical processing and biomanufacturing.
- PhD programs:ThePhD in Applied Life Sciencesis available to graduates of the MBS program.
- Postdoctoral Professional Masters in Bioscience Management(PPM): For post-doctoral fellows with backgrounds in science and engineering who want to acquire the business and management skills needed to pursue senior management positions within the life sciences industry or embark on entrepreneurial ventures intended to commercialize technologies developed in laboratories.
- Postbaccalaureate Premedical Certificate Program(PPC): For those who already have an undergraduate degree in science or engineering, and who want to improve their chances of gaining acceptance into medical school.
- Certificate in Bioscience Management:For PhD students and post-doctoral fellows from other institutions who have backgrounds in science but wish to acquire business and management skills in the applied life sciences.
- Doctor of Pharmacy (PharmD): Graduates from the School of Pharmacy will be prepared for the increasingly diverse roles pharmacists play in providing health care.
- Master of Science in Human Genetics and Genetic Counselings (MSGC): The two-year program is dedicated to benefiting society through the education, training, and development of innovative, collaborative, culturally-competent, articulate, and caring genetic counselors who will serve the needs of individual patients, the healthcare system, and the bioscience industry
- Master of Science in Human Genetics and Genomic Data Analytics (MSGDA):Upon completion of the two-year program, students will be able to utilize their foundation in genetics along with a practical knowledge of analytics to be able to translate information and bridge gaps between research scientists and practitioners.
- Summer Programs:KGI offers several unique summer programs tailored to suit undergraduate, pre-health, and post-doc students.
Frequently Asked Questions
What is Keck Graduate Institute's ranking?
Keck Graduate Institute ranks among the top 20% of community college in California for: Diversity in US community colleges.
Recent Articles

Obtaining Your Bachelor's Degree at a Community College
Explore the evolving landscape of community colleges offering bachelor's degrees, addressing affordability, accessibility, and workforce needs.

A to Z of Community College Certificates and Courses
From business and healthcare to technology and skilled trades, the article showcases the breadth of options available to students seeking to enhance their knowledge, develop new skills, or pursue career advancement.

What is a Community College?
This comprehensive guide explains what a community college is, its history, and its role in higher education. It covers the types of programs offered, differences from four-year colleges, benefits of attending, and important considerations for prospective students, providing valuable insights for those exploring educational options.


