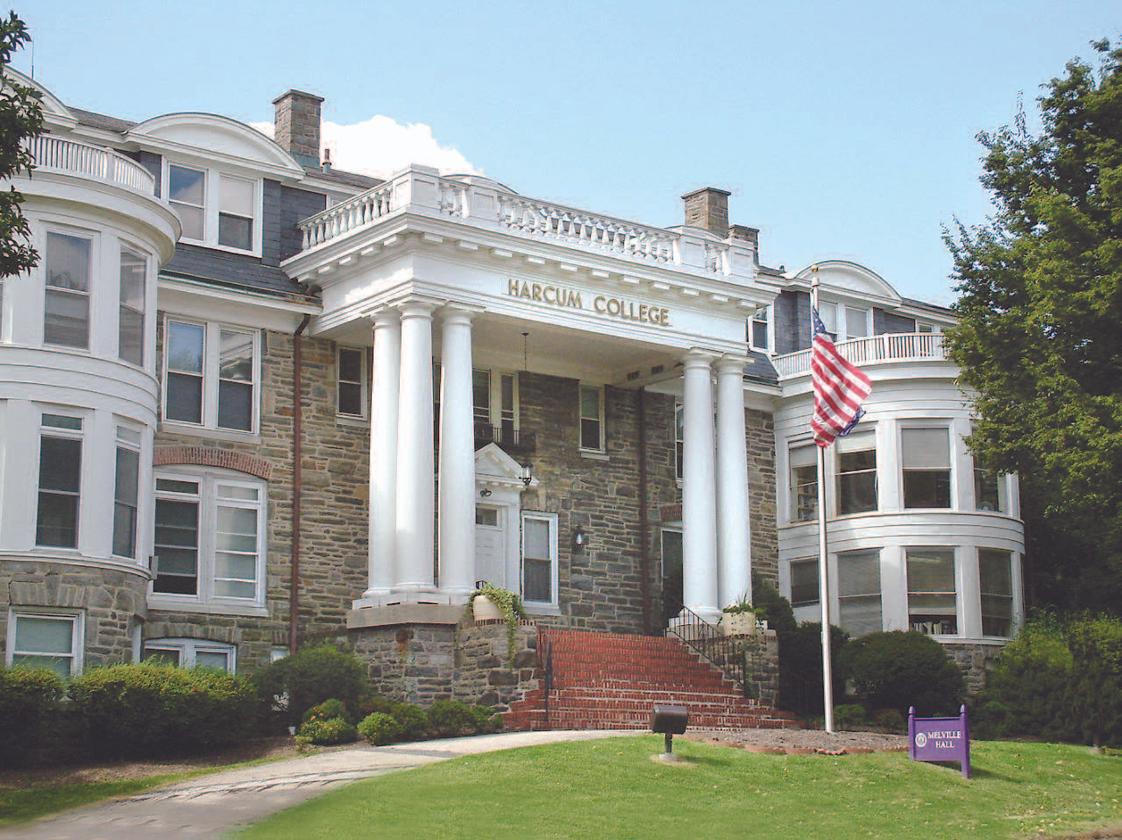
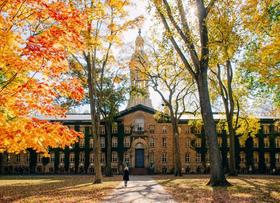
- Founded in Bryn Mawr, PA in 1915 by Edith and Octavius Harcum, Harcum College has for over a century educated students in the arts and occupational skills, respecting each student as an individual with personal needs, interests, aptitudes, and aspirations.
School Highlights
Harcum College serves 1,145 students (55% of students are full-time).
The college's student-teacher ratio of 4:1 is lower than the state community college average of 15:1.
Minority enrollment is 73% of the student body (majority Black), which is more than the state average of 48%.
Quick Facts (2026)
- Enrollment: 1,145 students
- Private-state tuition: $21,160
- Acceptance Rate: 94%
- Student-teacher ratio: 4:1
- Minority enrollment: 73%
- Source: Integrated Postsecondary Education Data System (IPEDS)
Top Rankings
Harcum College ranks among the top 20% of public schools in Pennsylvania for:
Category
Attribute
Diversity
School Resources
School Overview
The teacher population of 275 teachers has stayed relatively flat over five years.
Harcum College
(PA) Community College Avg.
Carnegie Classification
Associate's Colleges: High Career & Technical-High Traditional
Not applicable, not in Carnegie universe (not accredited or nondegree-granting)
Institution Level
At least 2 but less than 4 years
At least 2 but less than 4 years
Institution Control
Private not-for-profit
Private not-for-profit
Total Faculty
275 staff
59 staff
School Calendar
Student Body
The student population of Harcum College has stayed relatively flat over five years.
The student-teacher ratio of 4:1 has decreased from 31:1 over five years.
The Harcum College diversity score of 0.72 is more than the state average of 0.68. The school's diversity has stayed relatively flat over five years.
Total Enrollment
1,145 students
461 students
Student-Teacher Ratio
4:1
15:1
# Full-Time Students
634 students
325 students
# Part-Time Students
511 students
136 students
# Enrollment Undergraduate
114 students
298 students
# Full-Time Undergraduate Students
634 students
326 students
# Full-Time Graduate Students
n/a
10 students
# Part-Time Undergraduate Students
511 students
151 students
# Part-Time Graduate Students
n/a
12 students
Total Dormitory Capacity
330 students
330 students
% American Indian/Alaskan
n/a
n/a
% Asian
2%
5%
% Hispanic
12%
11%
% Black
42%
15%
% White
27%
52%
% Hawaiian
n/a
3%
% Two or more races
3%
3%
% Non Resident races
10%
1%
% Unknown races
3%
10%
Diversity Score
0.72
0.68
College Completion Rate (Students who graduate in less than 4 years)
34%
60%
College Completion Rate (Students who graduate in 4 years or more than 4 years)
n/a
36%
Average Graduate Earnings (10 Years)
$36,700
$34,900
Tuition and Acceptance Rate
The private state tuition of $21,160 is more than the state average of $17,231. The private state tuition has declined by 18% over four years.
Private State Tuition Fees
$21,160
$17,231
Tuition Notes
per year
% Students Receiving Some Financial Aid
97%
88%
Median Debt for Graduates
$18,500
$13,000
Median Debt for Dropouts
$6,500
$6,260
Acceptance Rate
94%
78%
SAT Reading (Year 2007)
425
465
SAT Math (Year 2007)
395
460
SAT Writing
n/a
435
ACT Composite
n/a
20
ACT English
n/a
20
ACT Math
n/a
21
ACT Writing
n/a
7
Sports
Total Sports Offered
4 sports
Sports
BasketballSoccer
Track and FieldVolleyball
Source: 2024 (or latest year available) Integrated Postsecondary Education Data System (IPEDS) , School Administrators
School Notes
- School Mascot: Hatcher The Bear
- Harcum has more than 20 majors in the liberal arts and professional studies, including dental hygiene, early childhood education, physical therapy, law & justice, and nursing, among others. The College offers Continuing Education and Professional Development courses, and degree programs at various partnership sites across the Delaware Valley. For admissions information call 610-526-6050 or email
- enroll@harcum.edu
- About 1,600 students from a variety of racial, ethnic, and religious backgrounds attend Harcum. Roughly 5% of students live on campus.There are dozens of student clubs and organizations in academic fields, sports, the arts, international and multicultural activities, community service, student government, publications and media, and other areas. Student life is lively off campus as well, as students take advantage of sports, cultural, and recreational opportunities on the suburban Main Line and in nearby Philadelphia.
- Harcum College has a respected and strong reputation in NJCAA Division I Athletics. Women`s basketball, men`s basketball, and women`s volleyball have all made it to their respective national championships.
- Here are some quick facts about Harcum Athletics:
- Men's Teams: Basketball, Cross Country, Soccer, Track & Field (Indoor & Outdoor)
- Women's Teams: Basketball, Cross Country, Soccer, Track & Field (Indoor & Outdoor), Volleyball
- Conference: NJCAA Region 19
- Nickname: Bears
- Colors: Purple and White
- Athletic Director: Drew Kelly
- Athletic Dept. Phone: 610-526-6669
- Athletic Dept. Fax: 610-526-6176
- Athletic Director Email:dkelly@harcum.edu
- Sample of notable school alumni/alumnae:
- Tara Focht, Professional Interior Designer -
- Joshua Mason, Entrepreneur -
Frequently Asked Questions
How much does Harcum College cost?
Harcum College's private state tuition is approximately $21,160.
What is the acceptance rate of Harcum College?
The acceptance rate of Harcum College is 94%, which is higher than the state average of 78%.
Who are famous alumni from Harcum College?
Harcum College famous alumni include: Tara Focht, Professional Interior Designer and Joshua Mason, Entrepreneur.
What sports does Harcum College offer?
Harcum College offers 4 interscholastic sports: Basketball, Soccer, Track and Field and Volleyball.
What is Harcum College's ranking?
Harcum College ranks among the top 20% of community college in Pennsylvania for: Diversity in US community colleges and Percent of students receiving financial aid.
Recent Articles

How to Transfer to a Four-Year University Without Losing Credits
Learn how to transfer to a four-year university without losing credits in 2026, including agreements, planning tips, and expert guidance.

First-Generation Student Guide to Community College Success
A first-generation student guide to navigating your first semester at community college, with academic, financial, and campus life strategies.

Most In-Demand Community College Majors for 2025–26
Explore the most in-demand community college majors for 2025–26 workforce needs, aligned with hiring trends, wages, and transfer pathways.


