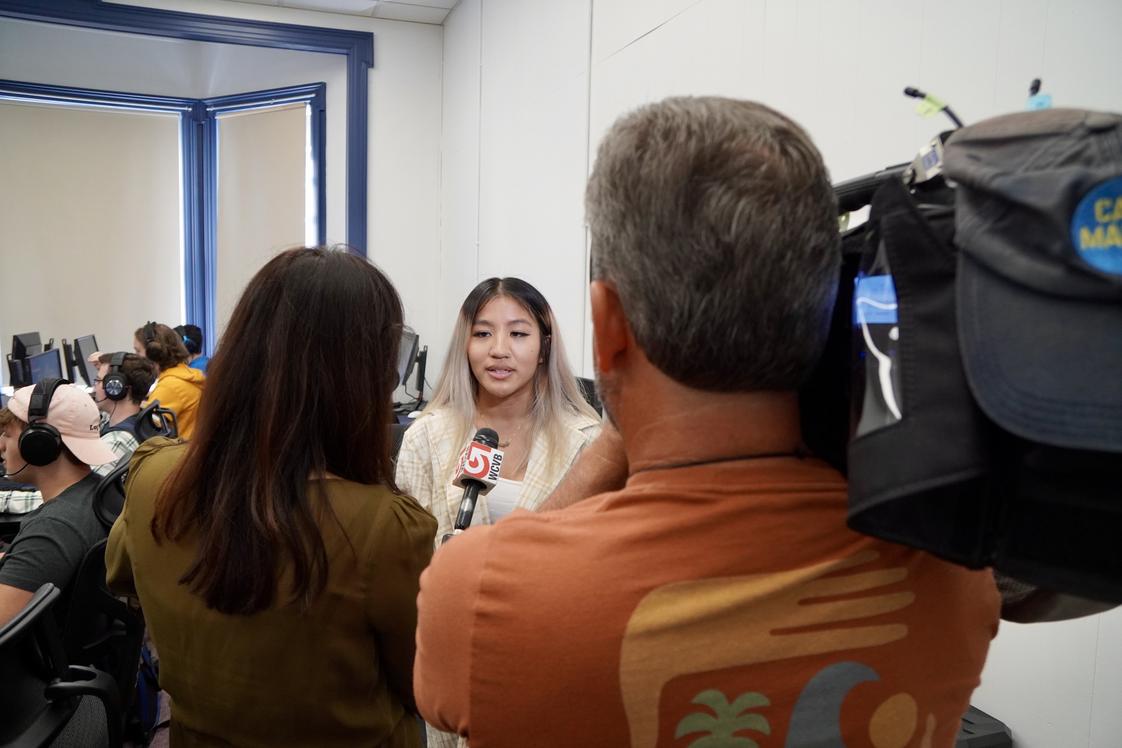
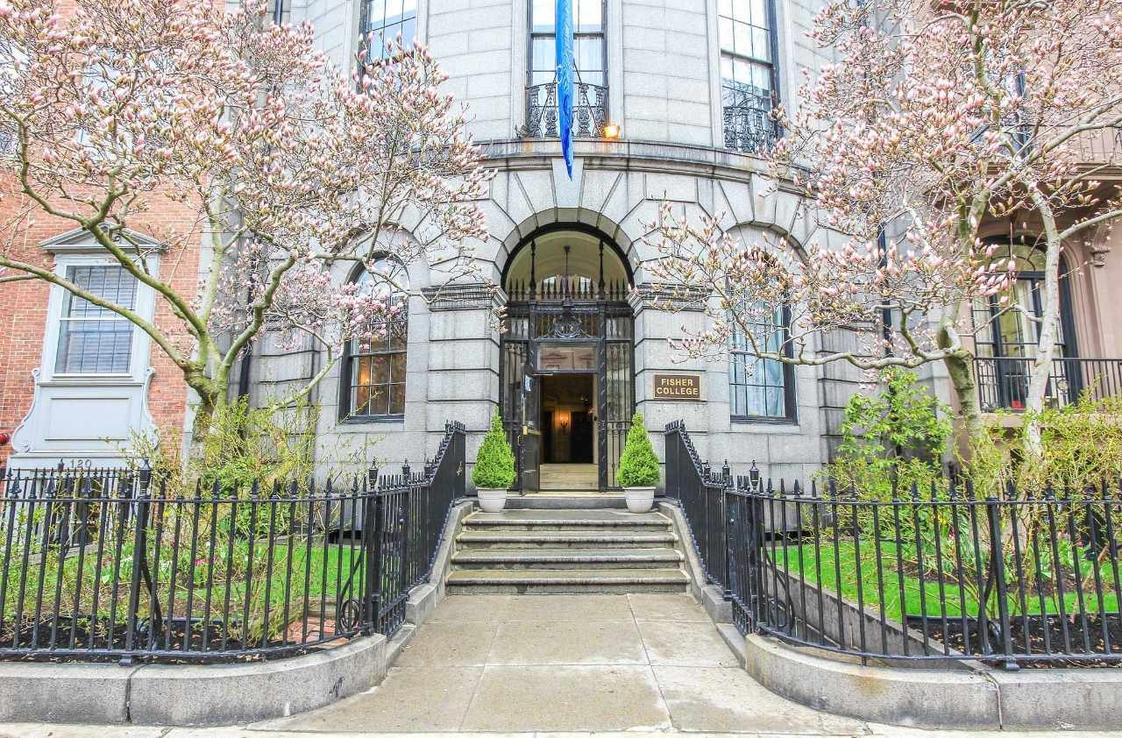
- Getting to know a college should be about more than majors and dining hall menus. At Fisher College, it`s about our faculty and administrators knowing your name - and you knowing ours. Through Fisher, you`ll find the world in Boston.Our students benefit from a personalized education path, mentorship from professors and an amazing range of experiences inside and outside the classroom. We want to see you enjoy yourself, grow into a more thoughtful and powerful individual, expand your horizons, and go on to shape our world at the very best companies and organizations across the globe. It all starts here.We are Fisher College - it`s nice to meet you.
School Highlights
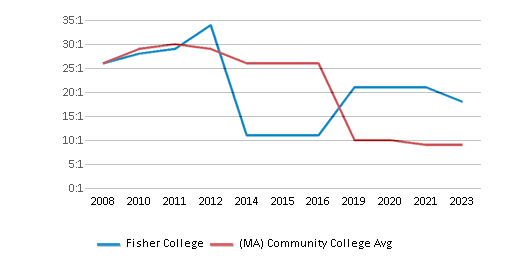
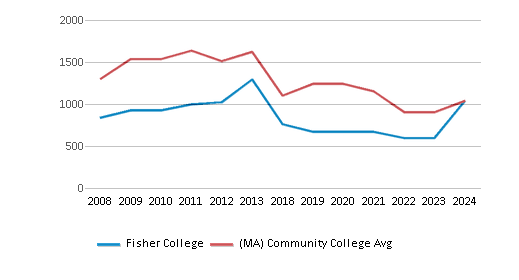
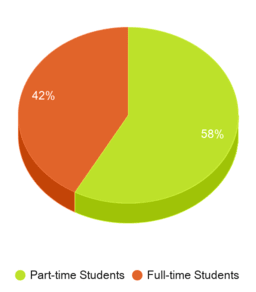
Fisher College serves 2,478 students (42% of students are full-time).
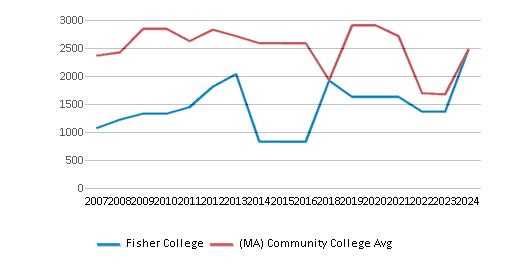
The college's student:teacher ratio of 32:1 is higher than the state community college average of 12:1.
Minority enrollment is 86% of the student body (majority Hispanic), which is more than the state average of 57%.
Quick Stats (2025)
- Enrollment: 2,478 students
- Private-state tuition: $35,013
- Acceptance Rate: 72%
- Student:teacher ratio: 32:1
- Minority enrollment: 86%
- Source: Verified school update
Top Rankings
Fisher College ranks among the top 20% of public schools in Massachusetts for:
Category
Attribute
Diversity
School Overview
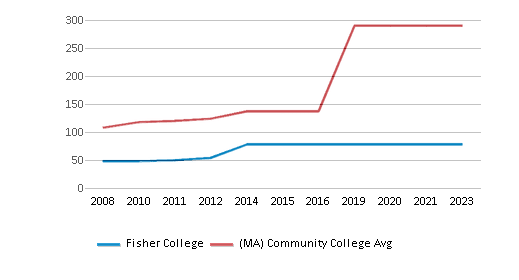
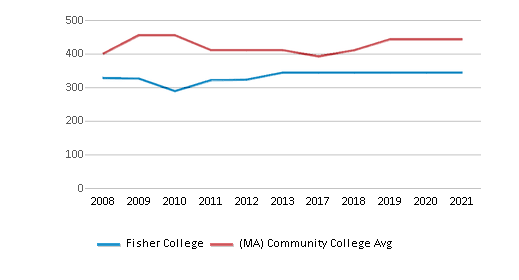
The teacher population of 78 teachers has stayed relatively flat over five years.
Fisher College
(MA) Community College Avg.
Carnegie Classification
Baccalaureate Colleges: Diverse Fields
Associate's Colleges: Mixed Transfer/Career & Technical-Mixed Traditional/Nontraditional
Institution Level
Four or more years
At least 2 but less than 4 years
Institution Control
Private not-for-profit
Public
Total Faculty
78 staff
290 staff
Number of Programs Offered
40
40
School Calendar
Student Body
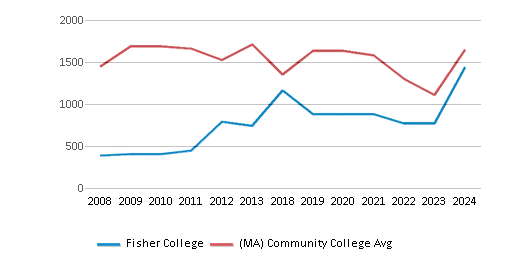
The student population of Fisher College has grown by 52% over five years.
The student:teacher ratio of 32:1 has increased from 21:1 over five years.
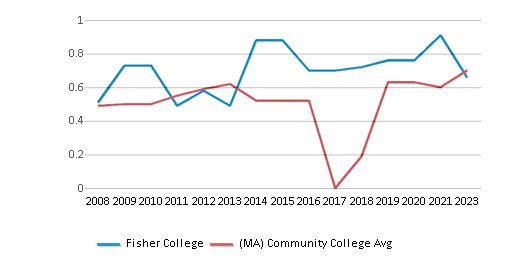
The Fisher College diversity score of 0.96 is more than the state average of 0.74. The school's diversity has grown by 26% over five years.
Total Enrollment
2,478 students
2,106 students
Student : Teacher Ratio
32:1
12:1
# Full-Time Students
1,039 students
1,039 students
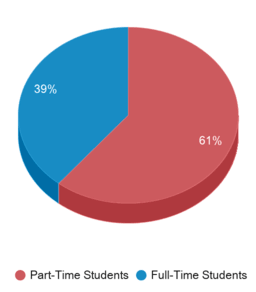
# Part-Time Students
1,439 students
1,619 students
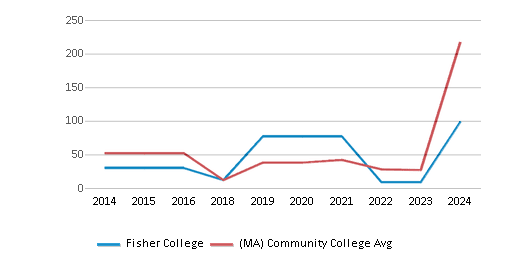
# Enrollment Undergraduate
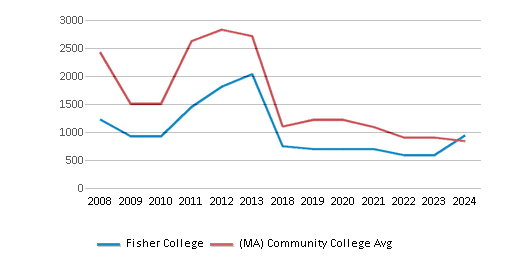
229 students
278 students
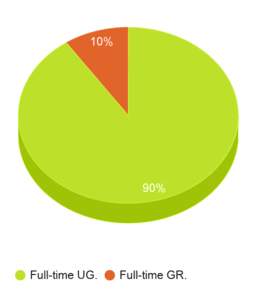
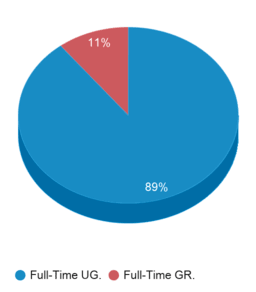
# Full-Time Undergraduate Students
940 students
839 students
# Full-Time Graduate Students
99 students
99 students
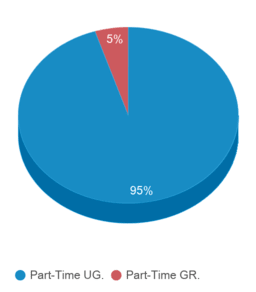
# Part-Time Undergraduate Students
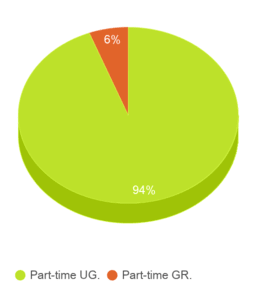
1,356 students
1,619 students
# Part-Time Graduate Students
83 students
83 students
Total Dormitory Capacity
n/a
443 students
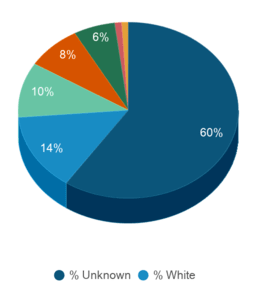
% American Indian/Alaskan
n/a
n/a
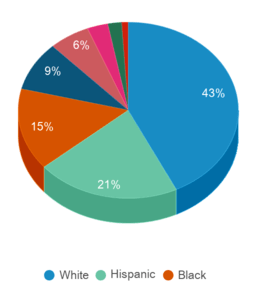
% Asian
1%
6%
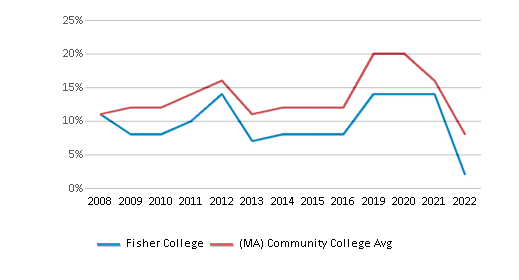
% Hispanic
10%
21%
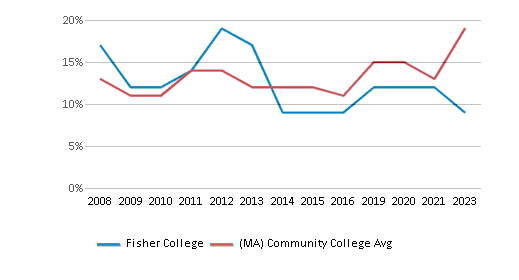
% Black
8%
15%
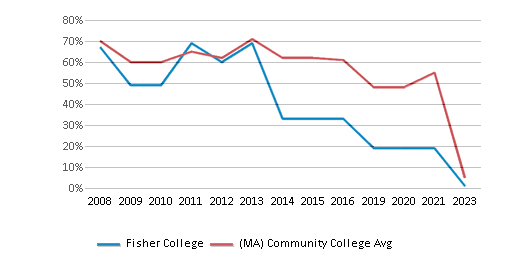
% White
14%
43%
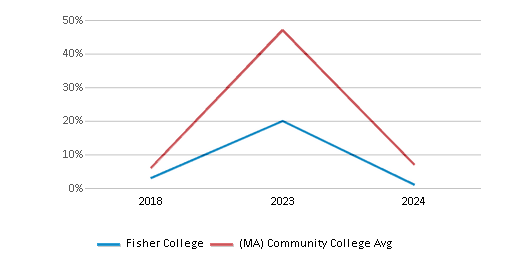
% Hawaiian
n/a
1%
% Two or more races
1%
3%
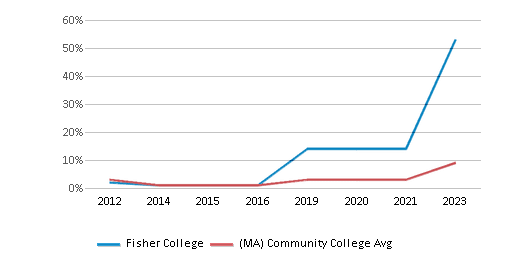
% Non Resident races
6%
2%
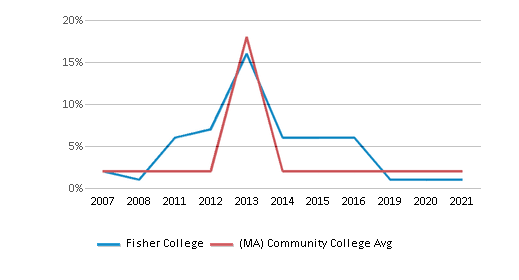
% Unknown races
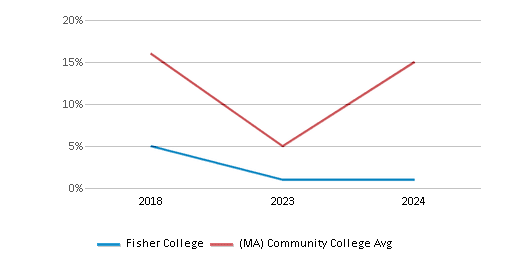
59%
9%
Diversity Score
0.96
0.74
College Completion Rate (Students who graduate in less than 4 years)
n/a
0.2128%
College Completion Rate (Students who graduate in 4 years or more than 4 years)
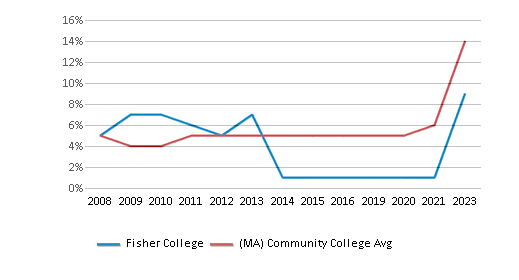
0.2632%
0.4706%
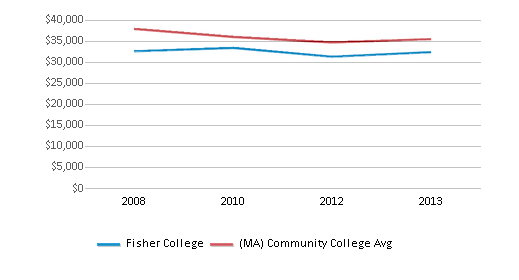
Average Graduate Earnings (10 Years)
$32,400
$35,500
Tuition and Acceptance Rate
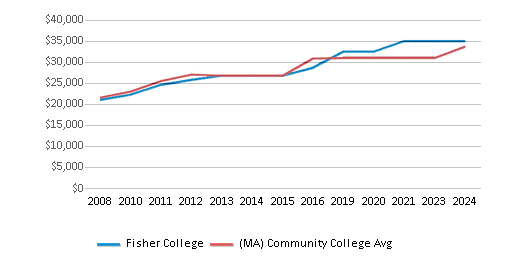
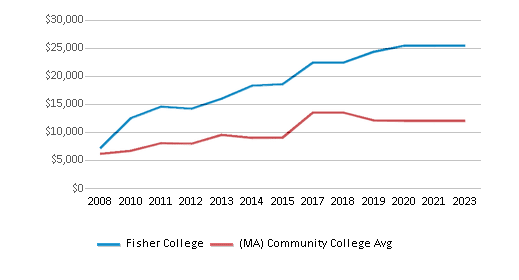
The private state tuition of $35,013 is more than the state average of $30,266. The private state tuition has grown by 7% over four years.
Private State Tuition Fees
$35,013
$30,266
Tuition Notes
Room and Board is an additional $17000 per year
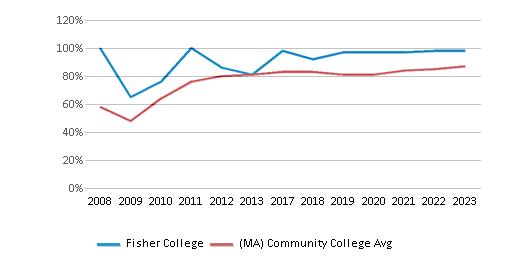
% Students Receiving Some Financial Aid
98%
87%
Median Debt for Graduates
$25,437
$12,000
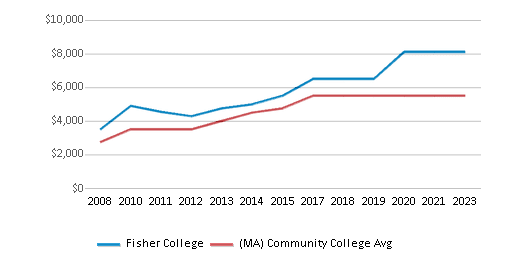
Median Debt for Dropouts
$8,107
$5,500
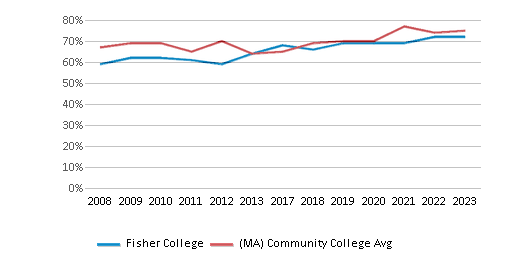
Acceptance Rate
72%
75%
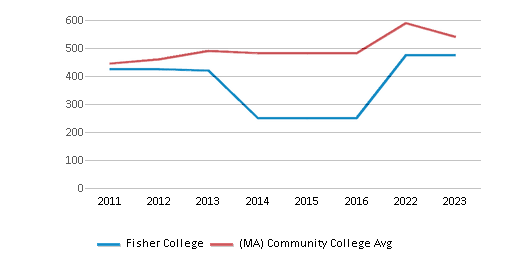
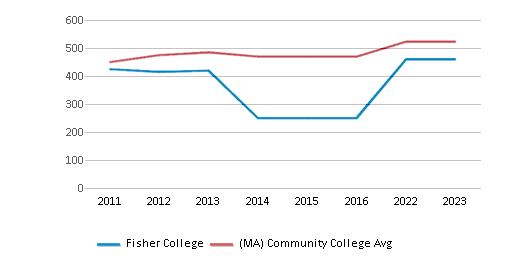
SAT Reading
475
540
SAT Math
460
523
SAT Writing
n/a
480
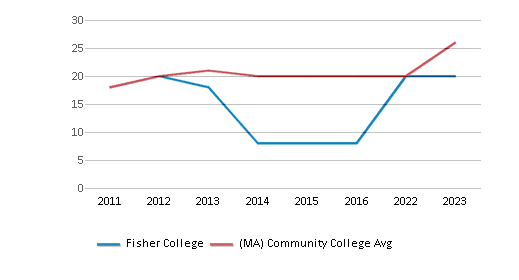
ACT Composite
20
26
Sports
Total Sports Offered
6 sports
Sports
Baseball, Basketball, Cross Country, Soccer, Softball, Volleyball
Extracurriculars
Total ExtracurricularsTotal Extra-curric.
4 extracurriculars
ExtracurricularsExtra-curric.
Club or Organization:
Criminal Justice Club, Drama Club, Fashion Club, LGBTQ Community
Criminal Justice Club, Drama Club, Fashion Club, LGBTQ Community
Source: 2024 (or latest year available) Integrated Postsecondary Education Data System (IPEDS) , School Administrators
School Notes
- It has been the tradition of Fisher College to serve the educational needs of different populations. In its Day Division, Fisher provides career and transfer programs in a small college setting. This division actively seeks a diverse student population reflecting a cross section of American and international cultures.
- The Graduate and Professional Studies Division offers degree and certificate programs both electronically and at locations in eastern Massachusetts to a broad spectrum of learners as well as to business and industry through courses, seminars, workshops, and training sessions. When it was founded in 1903, Fisher College emphasized vocational preparation for its first few decades. Since then curriculum plans and objectives have expanded.
- In 1952, Fisher was approved as a two-year college by the Board of Regents of Higher Education of the Commonwealth of Massachusetts, and, in 1957, was given degree-granting powers. In 1970, Fisher gained membership in the New England Association of Schools and Colleges, Inc., with accreditation. Today, students from all parts of America and from numerous foreign countries attend Fisher's Day Division. In January 1999 Fisher College was approved by the Massachusetts Board of Higher Education to offer the Bachelor of Science in Management Degree. In December 2009 Fisher College was approved by the Massachusetts Board of Higher Education to offer a Bachelor of Arts in Communication and Media Studies, as well as a Bachelor of Science in Human Services. Today, the college offers a wide variety of Bachelor degree and concentration options, including Psychology and Criminal Justice.
Frequently Asked Questions
How much does Fisher College cost?
Fisher College's private state tuition is approximately $35,013.
What is the acceptance rate of Fisher College?
The acceptance rate of Fisher College is 72%, which is lower than the state average of 75%.
What sports does Fisher College offer?
Fisher College offers 6 interscholastic sports: Baseball, Basketball, Cross Country, Soccer, Softball and Volleyball.
What is Fisher College's ranking?
Fisher College ranks among the top 20% of community college in Massachusetts for: Diversity in US community colleges.
In what neighborhood is Fisher College located?
Fisher College is located in the Back Bay neighborhood of Boston, MA. There are 1 other community '.college.' located in Back Bay.
Recent Articles

Obtaining Your Bachelor's Degree at a Community College
Explore the evolving landscape of community colleges offering bachelor's degrees, addressing affordability, accessibility, and workforce needs.

A to Z of Community College Certificates and Courses
From business and healthcare to technology and skilled trades, the article showcases the breadth of options available to students seeking to enhance their knowledge, develop new skills, or pursue career advancement.
What is a Community College?
This comprehensive guide explains what a community college is, its history, and its role in higher education. It covers the types of programs offered, differences from four-year colleges, benefits of attending, and important considerations for prospective students, providing valuable insights for those exploring educational options.

